J. Lyons Fund Management, Inc. Newsletter
| February/March 2013 |
Posted March 11, 2013 |
| Tweet |
 |
Full Circle
2013 Secular Bear Market Update
"People
somehow think you must buy at the bottom and sell at the top. That's
nonsense. The idea is to buy when the probability is greatest that the
market is going to advance."
- Martin Zweig
(1943-2013)
JLFMI's definition of a Secular Bear Market: a market that generally moves sideways over a period of typically 15-20 years, with intermittent wide swings down and up along the way. This year's secular bear market update comes at a particularly interesting time and price level in the stock market. The date of this writing marks the exact 4-year anniversary of the cyclical low made in March of 2009. The fact that the rally since then has persisted for four years is particularly noteworthy as illustrated later in this newsletter. Also at this writing, the S&P 500 is sitting precisely at the top of the 13-year secular bear market range around 1550. The market has therefore now come full circle from this same level in 2007, having hit the inauspicious low of 666 along the way. And lest investors forget, the market made a similar full circle from its top in 2000 around 1550 to a low in the mid-700's and back again to its peak in 2007. That price action could not be any more definitive of a secular bear market.
So while we celebrate the cyclical rally's 4-year anniversary and bulls are currently more horned up than we have seen in years, a little perspective is in order -- the market is right where it was 13 years ago. The question then now that the market has again come full circle is, can it finally break that vicious cycle, i.e., can it sustainably break up out of its range? The issue ultimately underlying that question is whether or not the secular bear market has come to an end. We think that is highly unlikely given the fact that the conditions from which durable secular bull markets are launched simply have not been reached. And it really isn't close. (See our letter, Condemned for background on how significantly worse off the market and economy are versus a corresponding time during the previous secular bear.) Therefore, the bear circle is likely to remain intact for some time, i.e., the market is more likely to head back down in the range rather than up and out of it. Sure, the market can stretch the circle by making marginal, temporary new highs, as it did during secular bears in 1946 and 1972. Those new highs did not last, however, and stocks subsequently endured another 3-9 years in their respective bear market ranges.
Thus, the secular bear market playbook remains in effect. If investors are to have a chance at growth from these levels, they need an Active Management strategy to enable them to avoid some of the losses during the down-cycles that erase all of the up-cycle gains during a secular bear. Based on recent fund flows, we recognize that, for various reasons, investors are considering making longer-term investment commitments now. Some are buying into the media's "stocks at new highs" hype; some are drinking the pundits' "valuation" kool-aid; and many other investors, having missed much of the 4-year bull market after bailing out at the lows in 2008-09, are looking to "get back in". Our recommendation is to heed the advice of the highly respected Mr. Zweig. If you are looking out several years, you want to invest when the probability of a market advance during that time is greatest. That is not now.
Let's look at the evidence why in our annual Secular Bear Market update.
Disclaimer: While this study is a useful exercise, JLFMI's actual investment decisions are based on our proprietary models. Therefore, the conclusions based on the study in this newsletter may or may not be consistent with JLFMI's actual investment posture at any given time. Additionally, the commentary here should not be taken as a recommendation to invest in any specific securities or according to any specific methodologies.
Secular Bear Markets
As a refresher, we refer to the long-term market cycle (i.e., moves that last years-decades) as a secular cycle. Since 1900 (and, in fact, much further back), the stock market has demonstrated a clear pattern of alternating secular bull and bear markets, each lasting 15-20 years.
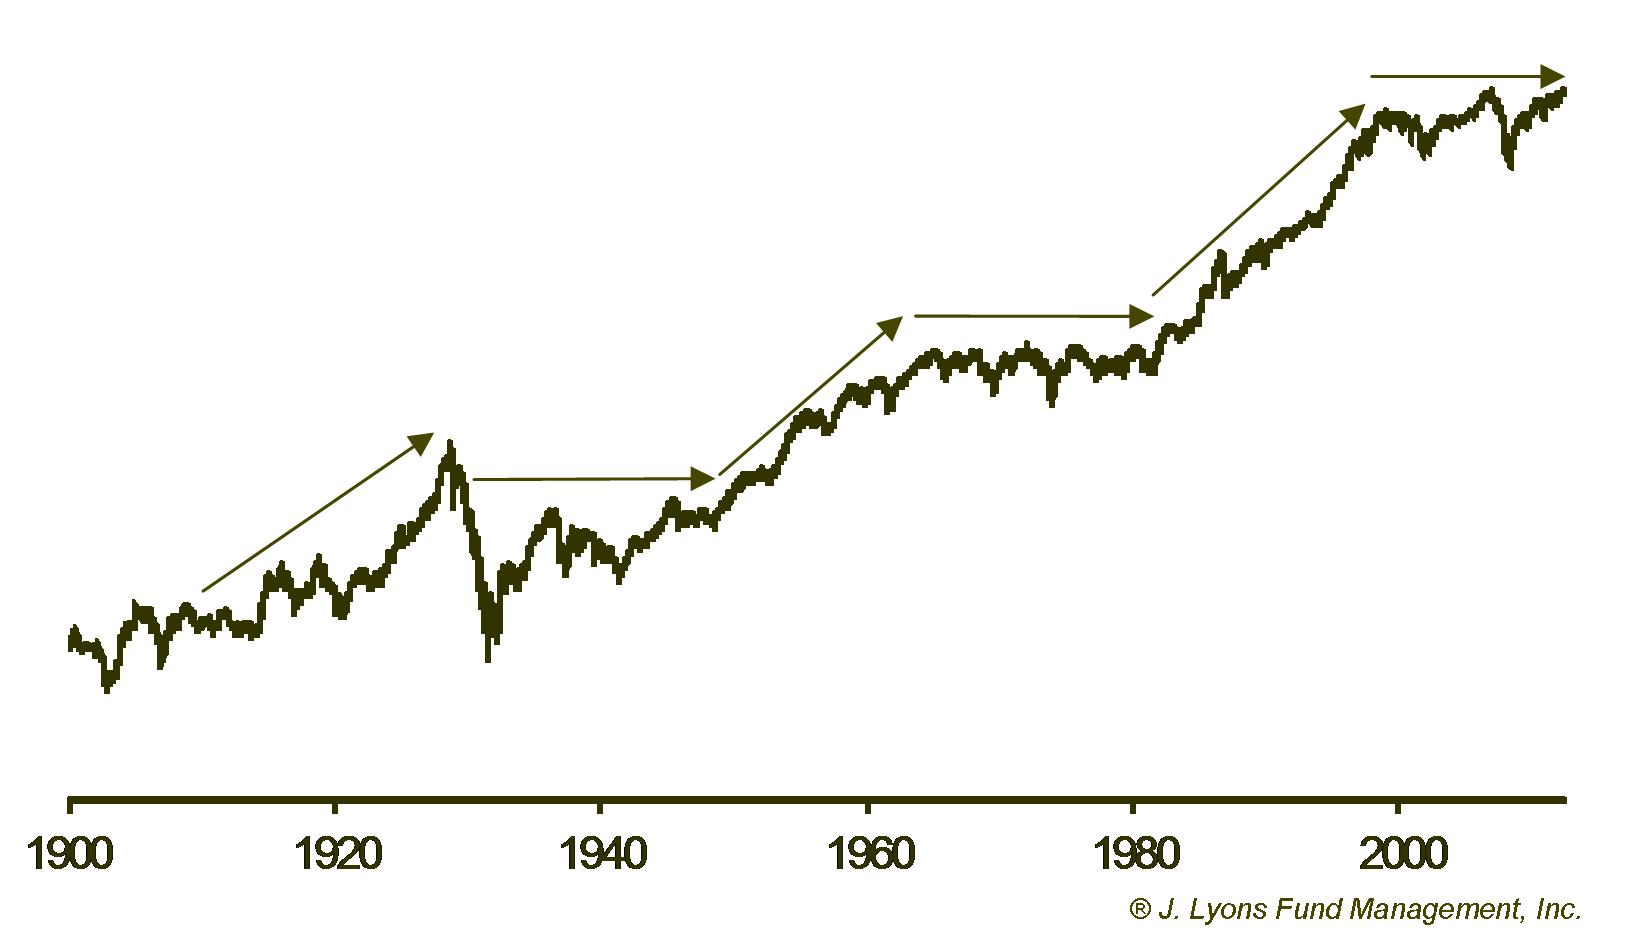
Secular bull
markets make successive, sustainable higher highs, like the move
from 1982 to 2000, and secular bear markets
generally move sideways
over the 15-20 years, with intermittent wide swings down and up along
the way. The market is currently 13 years into a secular bear
market that began with the bursting of the dotcom bubble in 2000. On a
shorter, or cyclical-term basis, it has been in an upswing since 2009.
However, the evidence suggests that risk is now greater than ever that
this upswing will soon come to an end.
Secular Bear Market Range
As mentioned, secular bear markets generally tend to move sideways within a wide range. That has been precisely the case in the current bear. Provided that range holds, one simple way to identify potential risk vs. reward is to measure the distance to the bottom and top of that range from the market's current level. By this measure, the risk to reward ratio is literally as unfavorable as it can be.
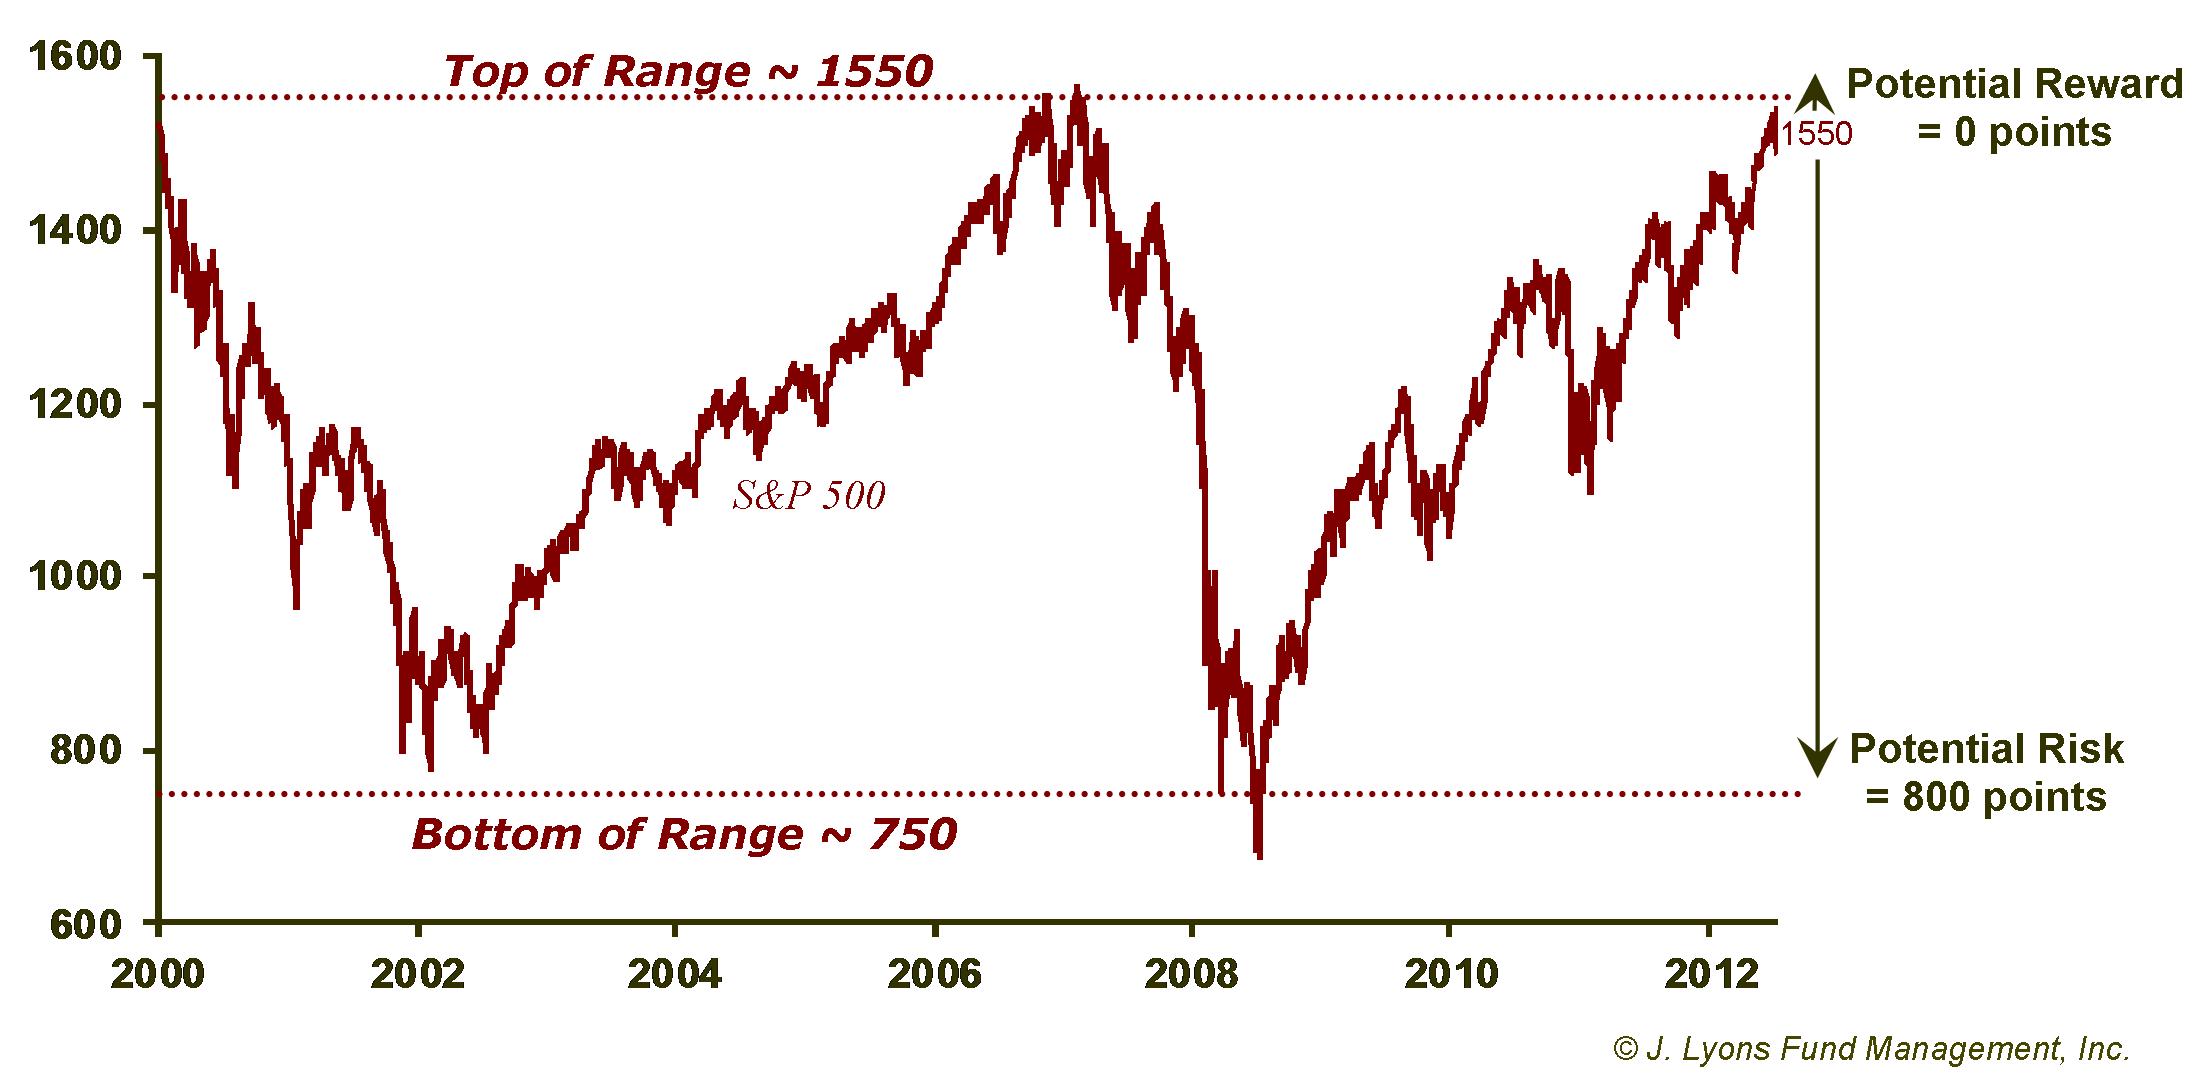
Considering that the S&P 500 has now traversed all the way back to
the top of the secular bear market range around 1550, there is no more
potential upside, or reward, left for investors (again, provided the
range holds). That leaves a potential entire range of approximately 800 points
squarely on the risk side of the equation. Whoever finds a risk to
reward ratio of about 800:0 attractive probably also plays the lottery, has a condo in Vegas
and owns shares of Pets.com.
The market certainly can go a bit higher than the top of the existing range, at least temporarily, as it did for a few months in 1972-73 during the previous secular bear. And it certainly may hold above the low of the range during its next cyclical decline. However, there is no evidence at all that the secular bear market has run its course. Therefore, the general sideways pattern should continue to hold form for several more years and, thus, the potential risk greatly outweighs the potential reward.
Secular Bear Market Composite Comparison
A few years ago, we constructed a Secular Bear Market Composite using market data from the 1929-1949 and 1966-1982 secular bears. We did so primarily in an effort to instruct others regarding our secular bear thesis -- that secular bear markets occur regularly, that a secular bear is currently unfolding and that the market should follow the general sideways pattern during the period. Although the construction of the composite was intended to illustrate the general pattern of a secular bear market, it was remarkable, even to us, how closely the first decade of the current bear market tracked the composite.
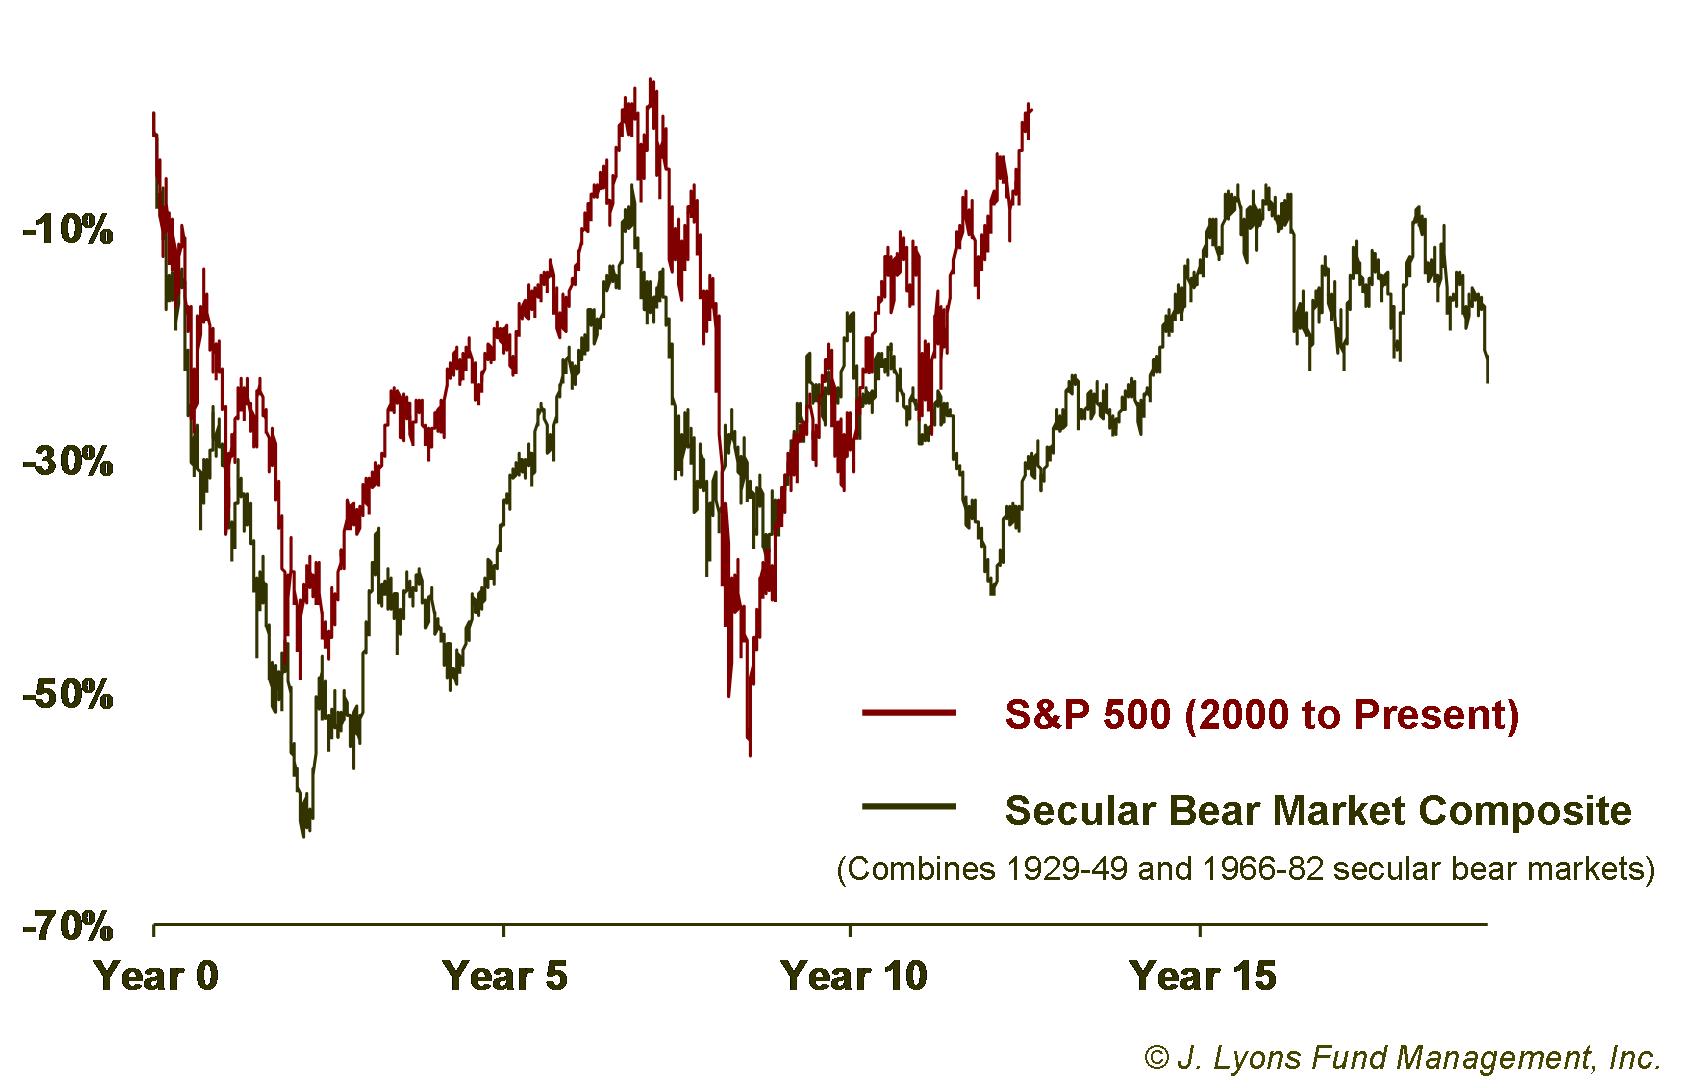
As
we have stated previously, the further we move
away from the beginning (2000) of the current secular bear, the more
likely the market is to deviate from the composite, at least in the
short-term. About a year ago, we pointed out a large divergence between
the current bear market and the composite. At the time, the market
was registering a positive divergence of 25%, or 2.5 standard
deviations, above the
level of the Secular Bear Composite. The only two other times the
market had reached such a divergence since 2000 occurred in 2005 and
2008. The S&P 500 moved sideways for 11 months following the former
occurrence and dropped 50% following the latter.
With the continuation of the cyclical rally over the past year, the divergence has continued to grow. In fact, the S&P 500 recently hit a peak of 36% above the level of the Secular Bear Market Composite, or more than 3.5 standard deviations!
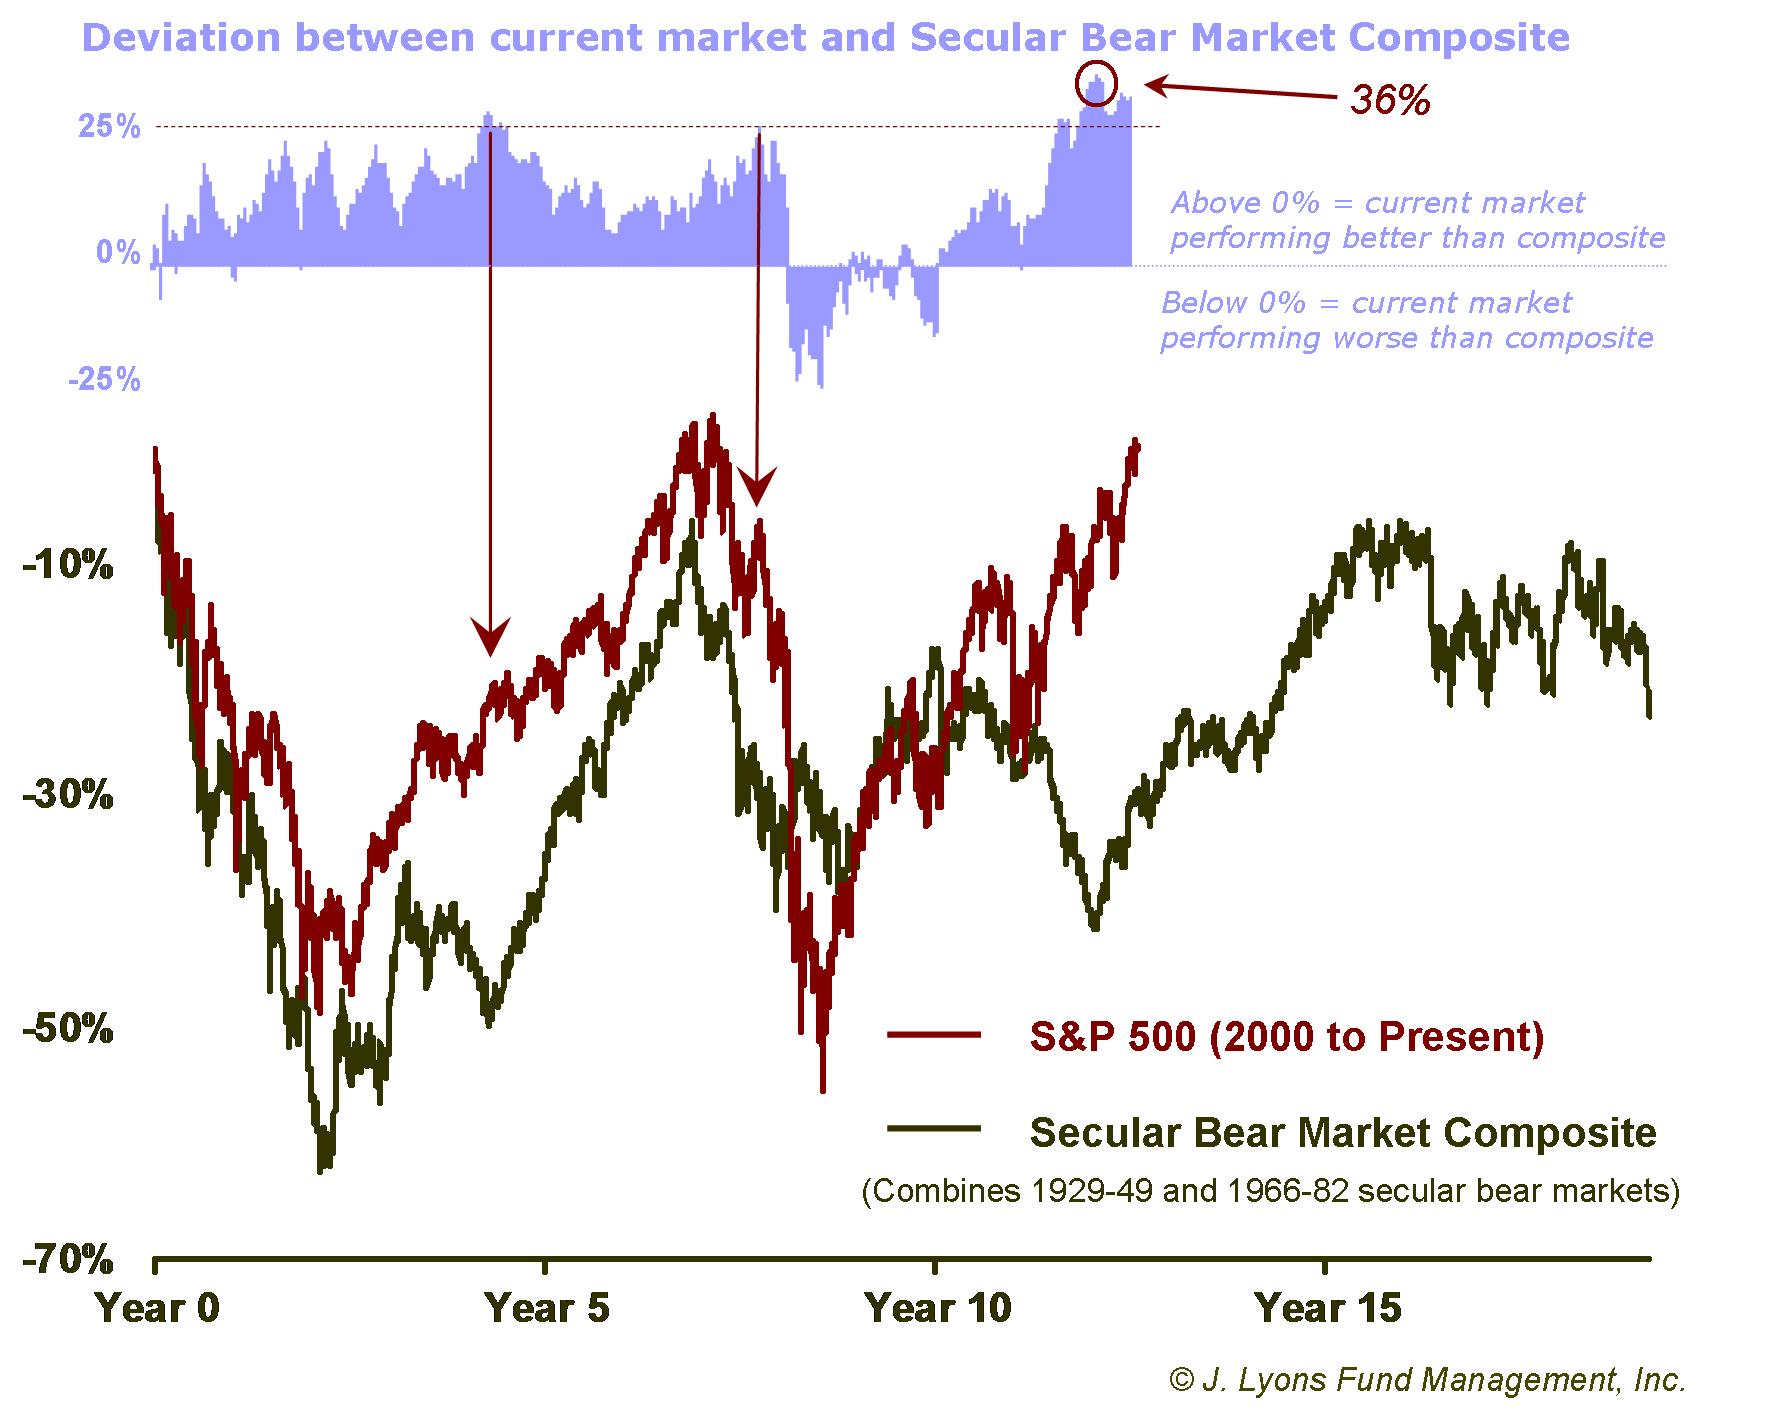
We have said that the older this secular bear market gets,
the less likely it is to conform as closely to the composite. However,
considering 1) the market is up against the top of the secular bear
range
and 2) there is no indication that conditions are in place to support a
new secular bull market, a divergence of this magnitude is a substantial
warning sign to us.
Cyclical Bull Markets within Secular Bears
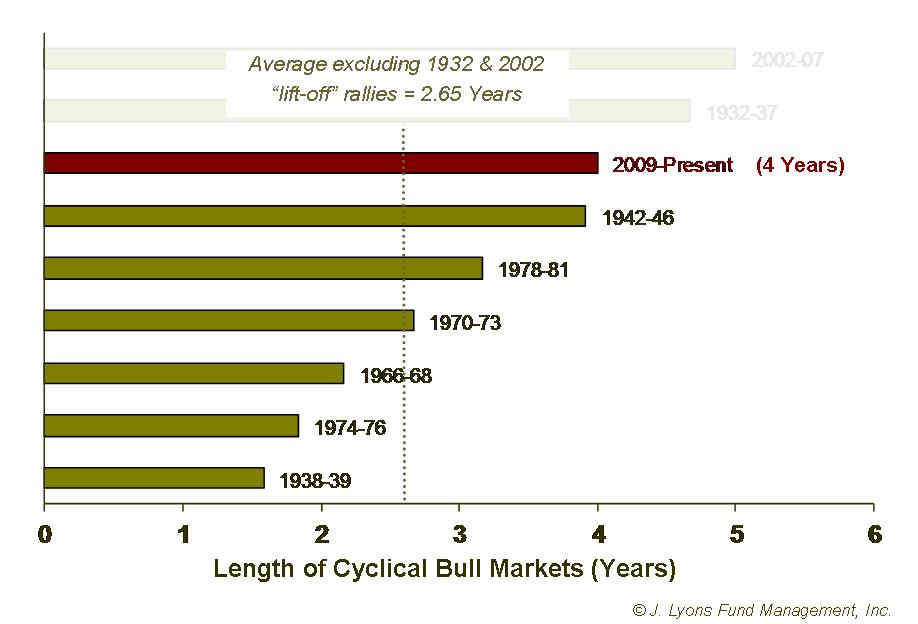
We posted another chart last year displaying the duration of all of the cyclical bull markets that have taken place within secular bear markets since 1929. As the rally has continued, we have updated this graphic as well. Our point a year ago was that, on a historical basis, the bull market was getting extended. Obviously, it is even more extended now. As the post-2009 bull market celebrates its 4th birthday, it is now nearly a year older than the average length of all such bull markets in the last 80 years.

We also pointed out last year that the average
duration of these rallies is skewed by the cyclical bull markets that began in
1932
and 2002. Those were the initial, or lift-off, bull
markets during their respective secular bear markets and immediately followed the bubble bursts of 1929
and 2000. It is expected, therefore, that those rallies will be stronger and longer given the preceding devastating bear markets.
And while the bear market from 2007-09 was also devastating, it was
shorter and did not include the bubble-bursting action of the post-1929
and 2000 declines.
If we exclude the "lift-off" 1932 and 2002 bull markets, the current bull has lasted almost a year and a half longer than average and is now the longest of any secular bear market rally since 1929. While it is impossible to extrapolate from this data the precise timing of the end of this bull market, it does suggest that it is on borrowed time.
Secular Bear Markets and the Presidential Cycle
One last topic we'll touch on in this secular bear market update is the presidential cycle and its market implications for the current calendar year. This cycle simply refers to the market's behavioral tendencies during the various four years of a presidential term. In general, the market tends to be the strongest during the latter half of a presidential term and weaker during the 1st half. We have found that tendency to be even more pronounced during secular bear markets.
Dow Jones Industrial Average - Last 100 Years
| Presidential Cycle Year | Average Return | Median Return |
| Year 1 | -2.4% | -10.0% |
| Year 2 | -3.1% | -3.1% |
| Year 3 | 8.6% | 6.4% |
| Year 4 | 1.2% | 3.7% |
Clearly the market has not fared well during the first year of a presidential term during secular bear markets, a label that applies to 2013. Over the last 100 years, the market has lost 2.4% on average during such years. Furthermore, the median return of such years during that period is -10.0%. The average return was skewed by the market's 64% gain in 1933. Excluding 1933, a year in which the market was coming off the low following the post-1929 bear market, the average return was -8.0%.
Dow Jones - Last 100 Years
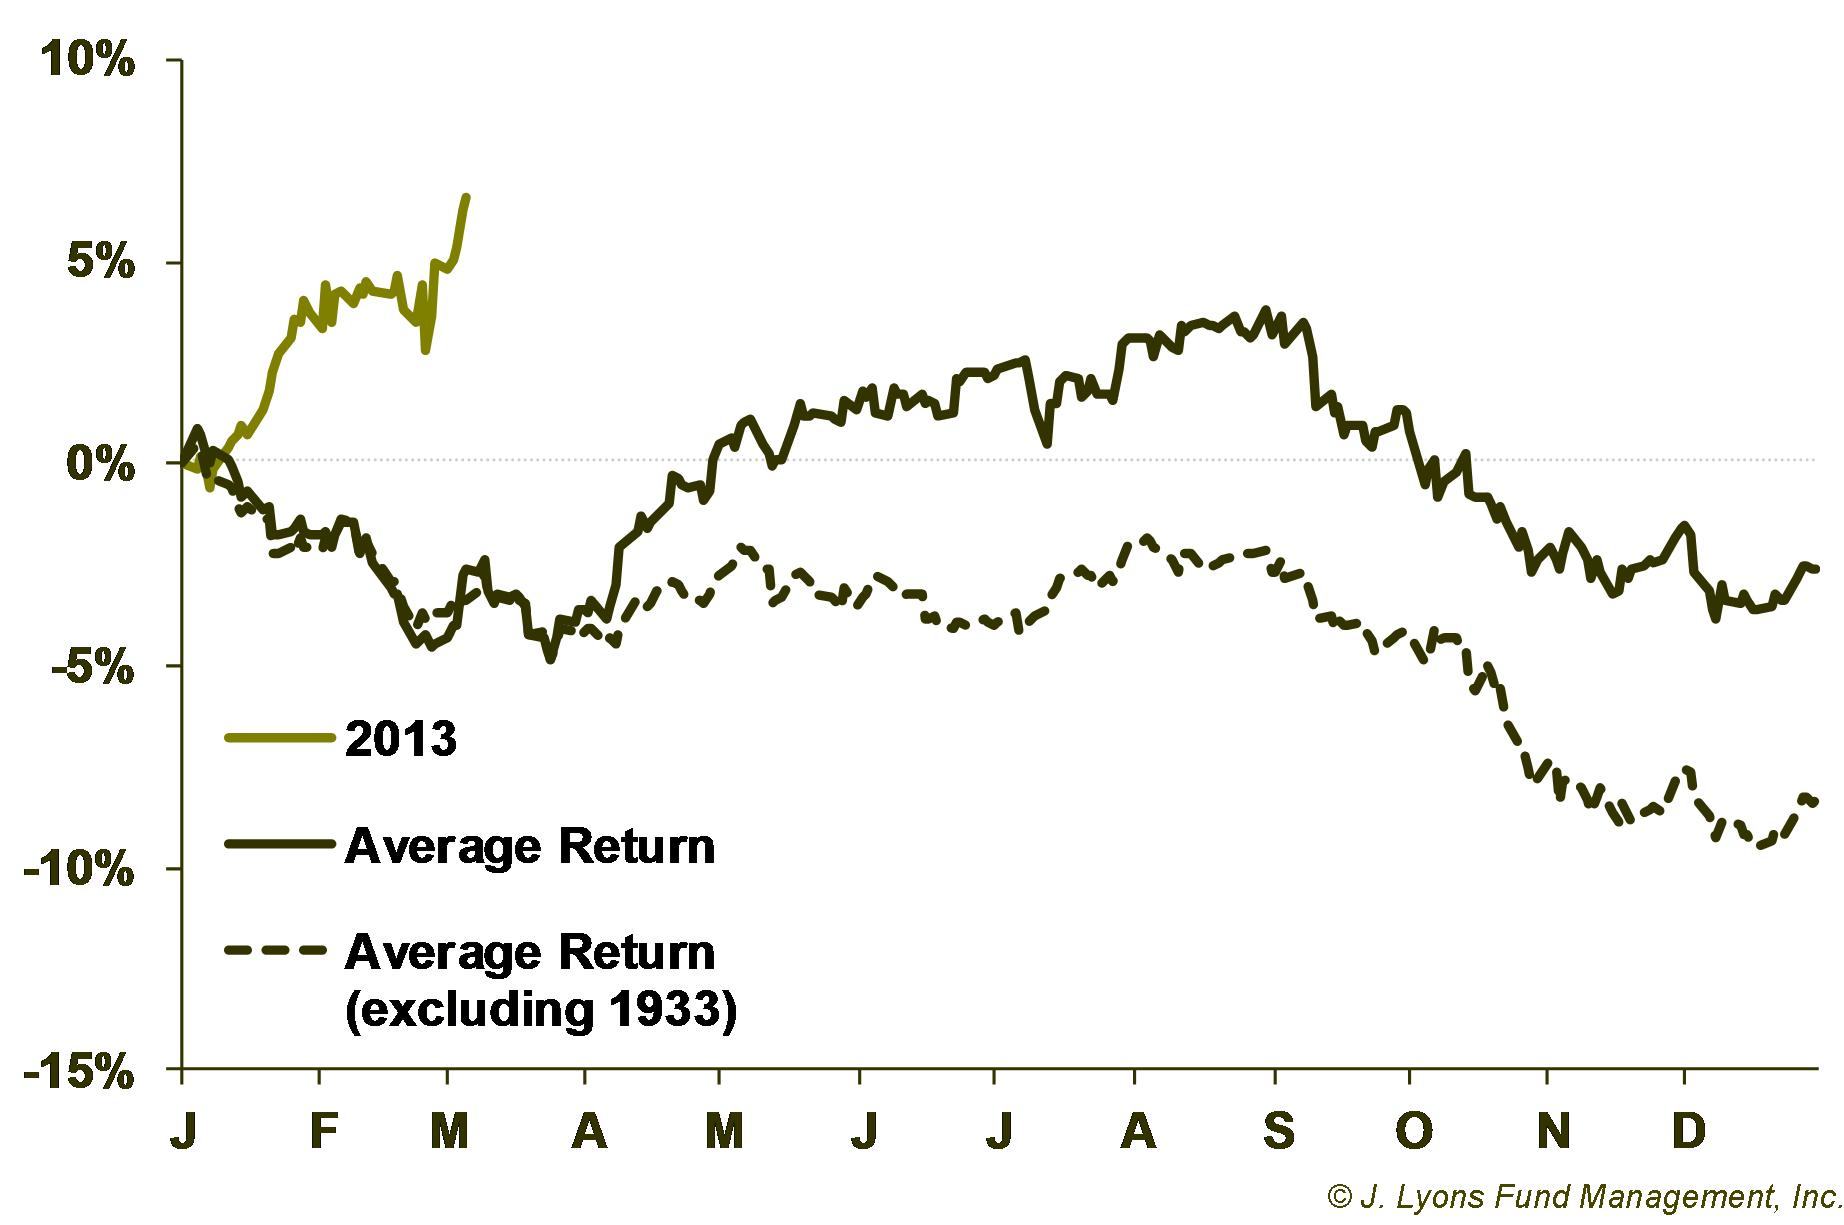
As
it stands, 2013 is starting out like a 1933-wannabe with the market up
some 6% in the first few months of the year. This is contrary to the
tendency of similar years to show weakness in the first quarter
followed by a mid-year bounce. Will 2013 be another 1933? It is very
unlikely, due most obviously to the fact that 1933 came on the heels of
a near-90% decline in the market while 2013 is now 4 years into a
cyclical bull market. In our opinion, the unusual strength to begin
this year only adds to our case of a market with significant gathering
risk.
Conclusion
Market Analysis
The preponderance of evidence suggests that, if this secular bear market is intact as we believe it is, stock market risk is nearing peak levels. It is possible that the market will make a temporary, marginal new high above the secular bear range. The current intermediate-term rally still has solid support and momentum and is, for now, the dominant factor in determining the market's direction. However, when that music stops, it will leave the market in a very precarious position. We have admittedly been sounding these warning bells for the past two years. However, our warnings have been primarily focused on the fact that stocks remain mired within the confines of the post-2000 secular bear market. Therefore, any gains afforded by market rallies will likely continue to be temporary as they are eventually erased in subsequent declines.
Furthermore, at this exact juncture, the market has reached the upper limit of the secular bear market range, with the S&P 500 having now come full circle from 1550ish to 750ish and back again twice since 2000. Based on the various metrics we looked at -- the market's position at the top of the range, its unprecedented divergence from historical bear market behavior, a severely aging cyclical advance and even unfavorable presidential cycle influences -- the stock market is about as risk-laden as it historically gets. Once that risk is triggered, likely sooner than later, the market should continue its circular path and head back down into the secular bear market range.
Investment Principle
If the secular bear market is intact, then the bear market investment playbook remains in effect. If investors are to achieve some level of growth (instead of merely surviving) during a secular bear, they need an Active Management strategy. Otherwise their investments, at best, will run in place for 15-20 years as each time the market rallies back to its high, it drops back again, dealing another blow to their portfolio and preventing them from getting ahead. We say "at best" because many, so-called, long-term, buy-and-hold investors, fearful of losing more of their hard-earned money, bail out of the market near the lows, preventing them from recovering during the ensuing rally. The point is to avoid much of the down-cycles in the first place as they not only bring about losses, but a loss of perspective as well. That way, investors can begin to build upon their portfolios again more quickly, rather than merely clawing back to even.
This approach certainly is not easy to successfully execute as it often requires one to make moves contrary to one's human natural instincts. Indeed, it is a challenge even for us. However, during a secular bear market that goes sideways for perhaps decades, it may be the only chance an investor has to get ahead. We do recognize that it is unrealistic to expect most investors to successfully devise and implement an Active Management investment plan. Such an undertaking requires a full-time commitment, substantial experience and strict discipline, let alone a profitable strategy. Our advice is to consider finding an investment professional with an Active Management approach -- and experience with implementing it -- to manage one's important retirement money or other such investments.
For investors going it alone and looking to commit capital investments now, we urge caution. As enticing as all of the "market at new highs" talk is, realize that market tops involve rallies which probe or make multi-year highs just to lure investors in before they collapse. Judging by investment flows into stock mutual funds and 401(k) transfers into stock options, that is precisely what is happening now. No doubt much of that recent activity is being driven by investors who have been underinvested or out of the market completely during the 4-year rally after bailing out near the lows in 2009. Don't compound that mistake with another one.
In a statement that would also describe our investment philosophy, Martin Zweig advised buying when the probability was greatest that the market would advance. From a secular perspective, it may still take several more years, and an abundance of patience, until we reach that point. It certainly is not now.
Dana Lyons
The
commentary
included in this newsletter is provided for informational purposes
only. It does not constitute a recommendation to invest in any
specific investment product or service. Proper due diligence should be
performed before
investing in any investment vehicle. There is a risk of loss involved
in
all investments.
| Tweet |
|