J. Lyons Fund Management, Inc. Newsletter
| August/September 2012 |
Posted September 20, 2012 |
| Tweet |
 |
Condemned
Due
to insufficient repairs, the remainder of this secular bear
market
is likely to be even weaker than the lackluster historical precedents.
Much of the drama and consternation in the markets recently has been focused on Europe, and deservedly so. The economic situation there, particularly among the PIIGS (or PFIIGS if you include France) is dire and perhaps irrecoverable. We would caution against too much optimism regarding the latest bailout "solution" engineered by the ECB. It is simply more smoke and mirrors that, while igniting a short-term rise in stocks and other asset prices, just ensures the eventual fall from now higher prices will be that much harder. However, in the spirit of "fair share", we will remind readers that the U.S. market has its own serious and long-term problems to deal with (regardless of -- and partially because of -- the Fed's own actions.) And that has greater ramifications for investment accounts and retirement fortunes here in the U.S. than does the Euro sty.
Many of our newsletters have focused on the existence and implications of the ongoing secular (long-term) bear market in the U.S. Most recently we outlined the reasons why we see elevated risk at the present juncture in the secular bear as well as detailing the likely potential extent of the current risk. Such analyses result from our study of prior secular bear markets and their behavior at similar points in the cycle as the present. The conclusion of this historical comparison, unfortunately, is that this secular bear market will probably persist for the better part of the remainder of the decade. Evidence from prior secular bears suggests that, while the market is unlikely to make any sustainable progress until the bear runs its course, the worst declines of this bear may have passed. Upon further inspection, however, the outlook may be worse than that implied by the historical precedents.
Secular bear markets are caused by various conditions of excess being built up during the preceding bull market phase of the cycle. For example, the bull market that lasted from 1982 to 2000 resulted in excessive imbalances in many areas of both the economy and the stock market, i.e., too much spending vs. saving and too many eager stock buyers vs. sellers. These imbalances must be repaired in order to bring about healthy conditions from which the economy and market can again achieve sustainable progress. This process of repair is what marks secular bear markets and the sooner those imbalances are repaired, the sooner the next boom phase can begin.
Unfortunately, the current secular bear has not yet undergone the level of repair needed. In fact, compared with prior secular bears, the current one is lagging woefully. Here, we present a few examples of such lacking repairs from the following areas of the economy and stock market:
- Household financial health
- Household income
- Stock market valuation
- Investor behavior
In our analysis, due to this lack of repair, the back end of this secular bear market is quite likely condemned to an even worse fate than its predecessors.
Disclaimer: While this study is a useful exercise, JLFMI's actual investment decisions are based on our proprietary models. Therefore, the conclusions based on the study in this newsletter may or may not be consistent with JLFMI's actual investment posture at any given time. Additionally, the commentary here should not be taken as a recommendation to invest in any specific securities or according to any specific methodologies.
Secular Bear Market Repairs Lagging Historical Precedents
If historical market patterns hold, this secular bear market should be approximately two thirds of the way over. Studies (see January & July Newsletters) of similar junctures in prior secular bears have yielded a few observations:
- The worst of the secular bear market losses were over
- There were no sustainable gains over the remainder of the secular bear market
So we have a general script for how the rest of this secular bear might unfold over the next 6 or so years. However, that script is predicated on the unhealthy excesses which led to the secular bear market being wrung out, or repaired. Until those excesses are repaired, it is difficult to imagine a new secular bull market beginning.
Here, we look at a few of the excesses that were built up during the secular bull market from 1982-2000 that need to correct before the next bull kicks off. Specifically, we mainly compare their level of repair to what occurred during the previous secular bear market from 1966-1982. We also compare current data with older secular bear markets when possible; however, many economic data series do not go back far enough to accommodate such comparisons.
Household Financial Health
With consumption comprising some 70% of U.S. GDP, the American household is obviously integral to the long-term growth prospects of the economy and the market. Both 1) a healthy balance sheet and 2) the propensity to spend are keys to such growth. Looking historically at the behavior of one side of the balance sheet, household debt, it is clear to see the expansion of debt coinciding with the past two secular stock market expansions from 1950-1966 and 1982-2000.
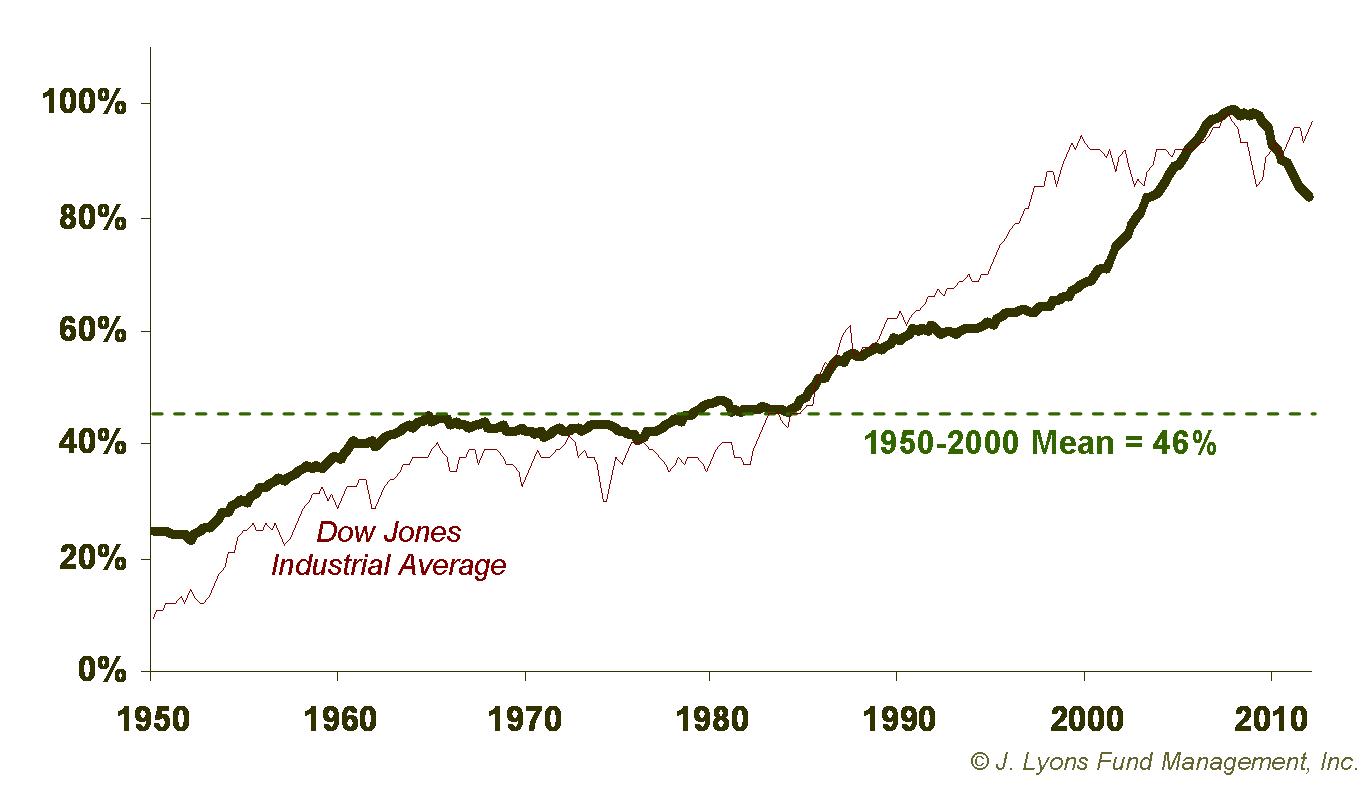
What is also clear are the astronomical heights to which
household debt soared during the latest expansion. When the secular
bull market ended in 2000, household debt had reached a whopping 70% of
GDP. Thanks to the propensity to spend, the increasing leverage on the
part of households added fuel to the expansion. It wasn't
problematic...until it was. The truly frightening debt increases
occurred after
the bull
market ended when, far from correcting, household debt soared further
to 100% of GDP by 2008, over double the 1950-2000 average (thank you,
Fed). The fact that the stock market was unable to advance during that
period of historic leveraging was a warning.
During the 1966-1982 secular bear market, households began to repair their debt burden immediately. Although, household debt then never corrected to near its lows of the early 1950's, at the least it did not continue to rise. 16 years without incurring any meaningfully higher levels of debt was enough repair, especially considering the improvements in other areas of their balance sheet, to allow for the start of a new secular bull market in 1982.
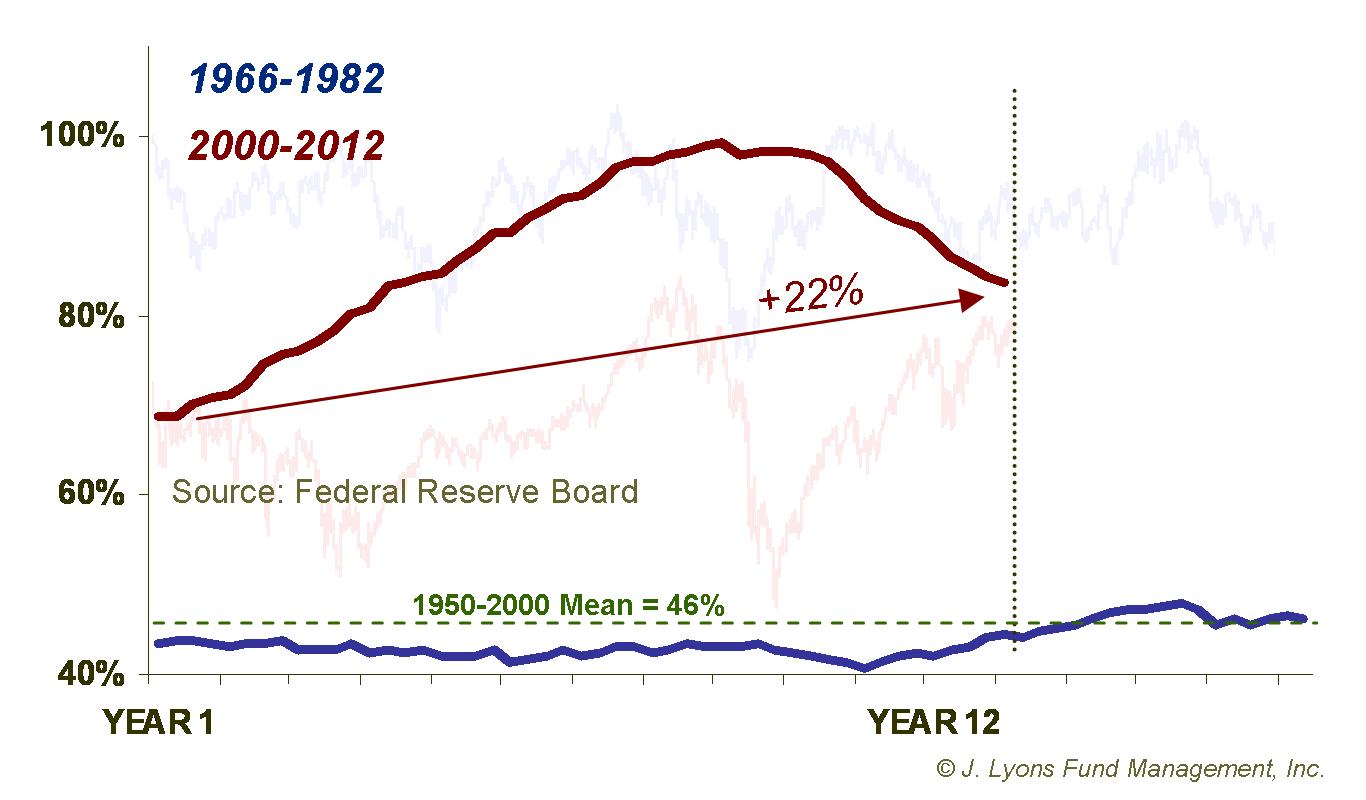
Even
with the drop over the past 4 years, household debt is still 22% higher
than it was at the start of the secular bear in 2000. The combination
of still-unhealthy high level of debt and the household deleveraging
trend underway presents the worst of both worlds as far as stock market
and economic growth is concerned. The extent to which debt levels need
to fall (to 2000 levels?, closer the long-term mean?) is unclear. What
is clear is that, barring miraculous offsets elsewhere, debt levels
must come down substantially for the financial health of U.S.
households. Repair in the form of this much-needed
deleveraging is
necessary to allow for a new secular
economic and market expansion.
Other examples of household financial health in need of repair: net worth, savings rate
Household Income
One potential "miraculous offset" to debilitatingly high levels of household debt would be a simultaneous and greater increase in revenue, namely household income. Though highly improbable, if real income rose quickly enough, it could offset the debt deleveraging by "making it up in volume". Unfortunately, not only is this notion far-fetched but in reality, the opposite is actually occurring. As of the end of 2011, median household income was actually down 9% since the secular bear began in 2000. Except for the year before, that is the steepest 11-year decline in the data's history going back to 1966.
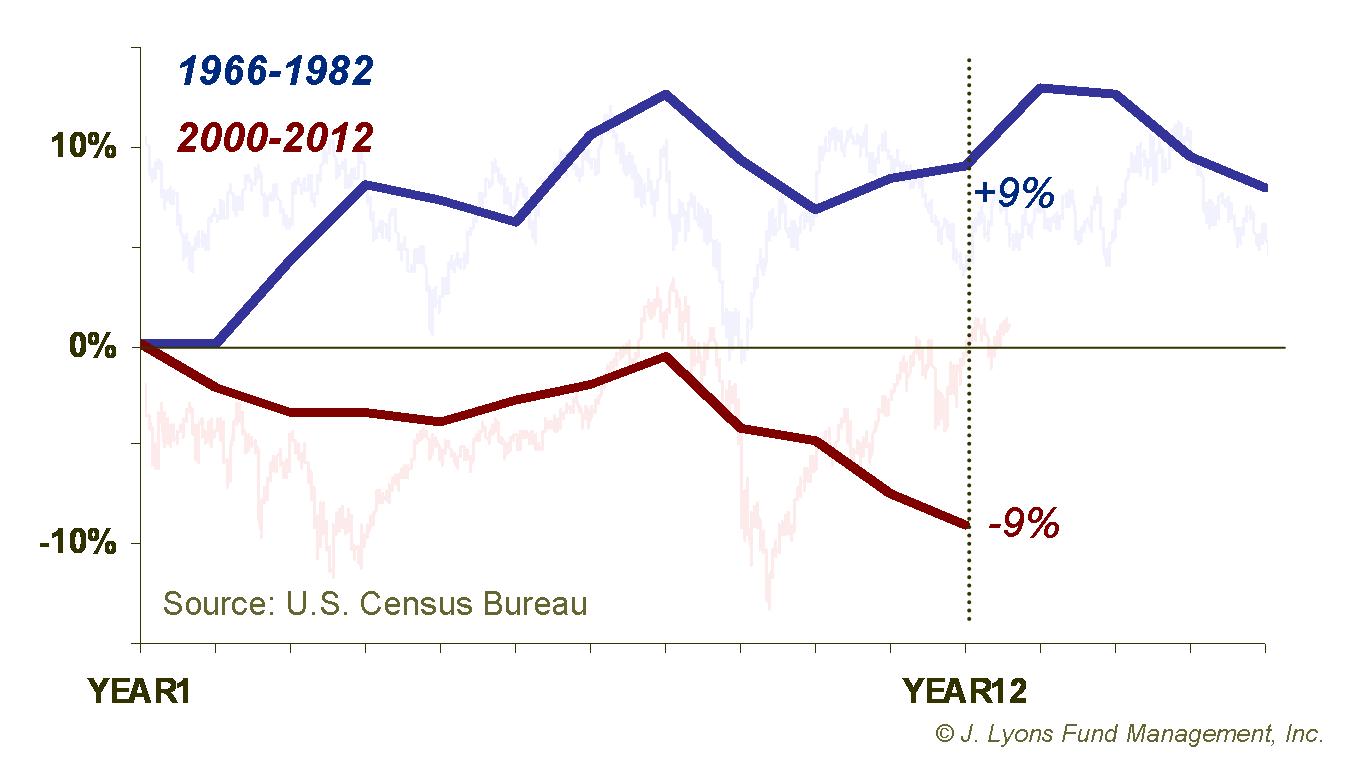
In order to repair the buying power of U.S. households, income needs to
rise, not fall. Twelve years into the last secular bear in 1978, median
income was up 9% and buying power was slowly being restored. The
current downtrend in income in combination with households'
deleveraging presents a double whammy to economic prospects. And it is
difficult to fathom a new secular bull market getting underway with the
state of U.S. households in much worse shape than at this point in the
last secular bear.
Other areas impacting household income that are in need of repair: disposable personal income, unemployment rate
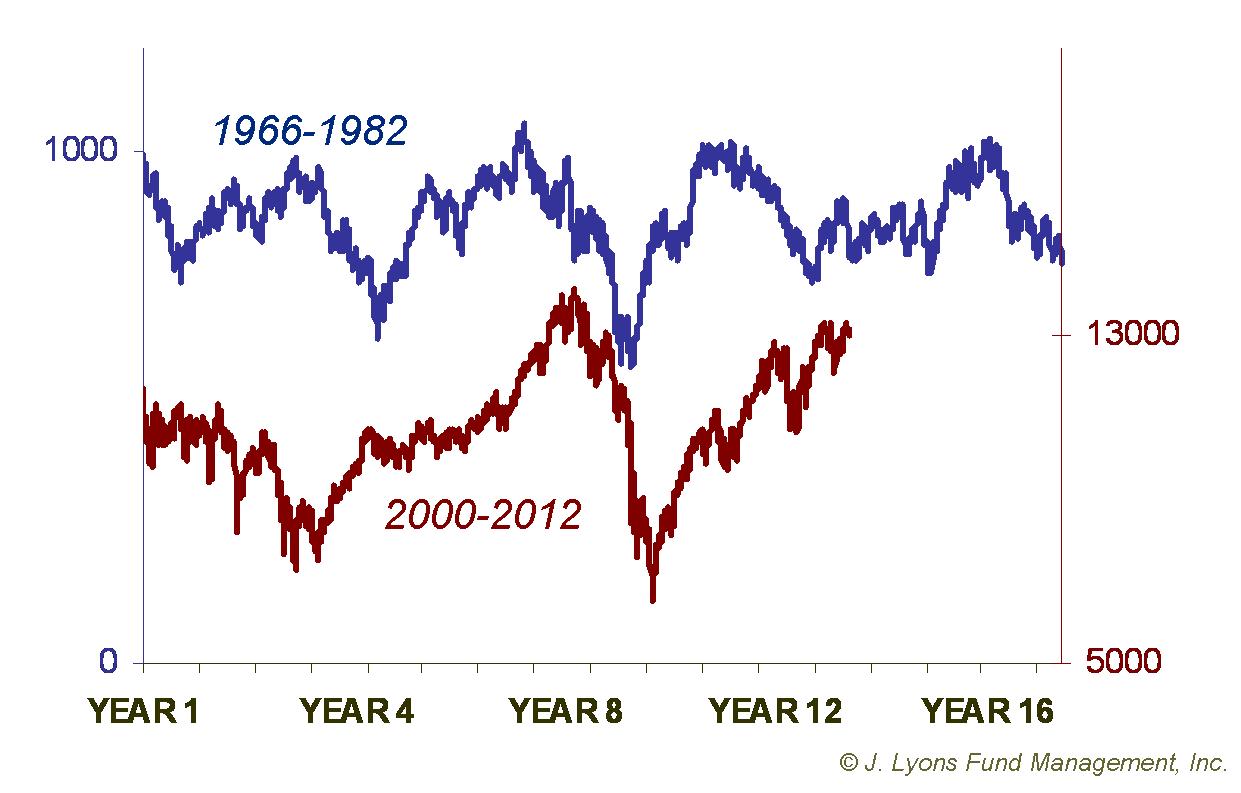
Stock Market Valuation
Perhaps the most straightforward method of determining a market's point in the secular cycle is valuation. That is, measuring how cheap or expensive the market is by historical standards. The most definitive valuation measure is the price/earnings ratio (P/E) which divides the price of a stock (or index) by its earnings (or collection of earnings). The P/E ratio has been a very consistent marker of secular turning points over the past century (in fact that is arguably all it is good for; see our April Newsletter).
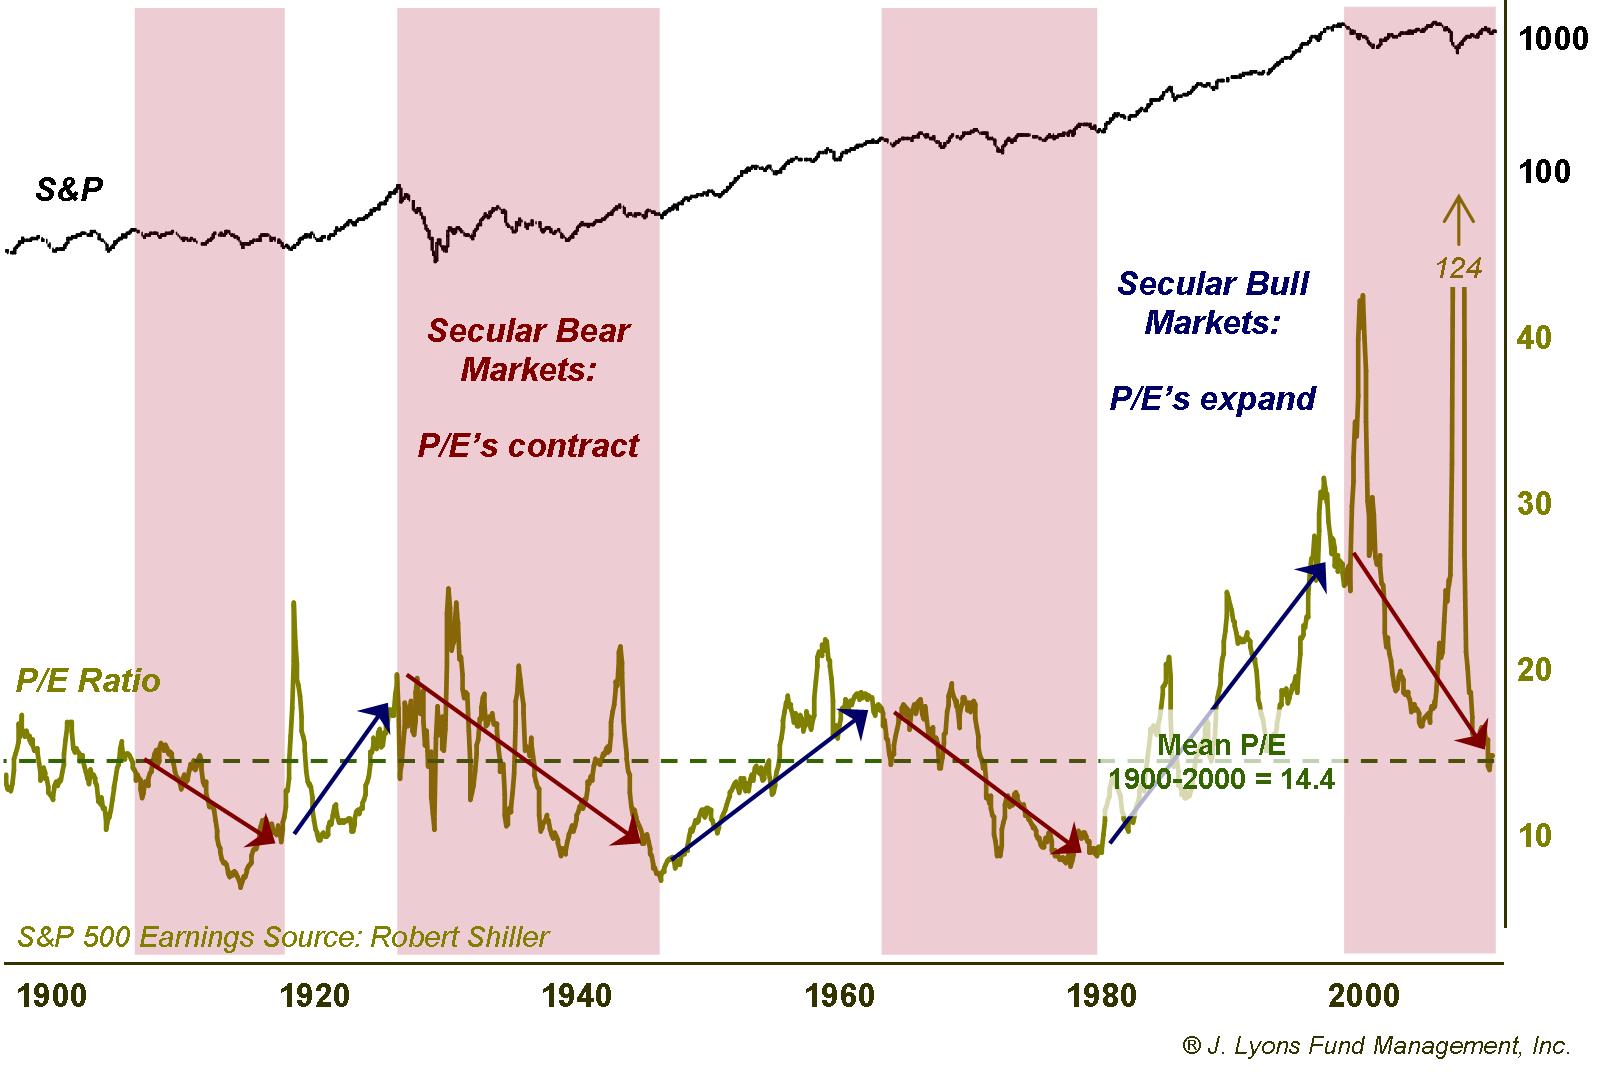
At secular bull market peaks, the P/E ratio on the S&P 500
has reached very extended, or expensive, levels. Conversely, the P/E
ratio has fallen to the 6-9 range before the last three secular bear
markets ended in 1921, 1949 and 1982. As with household debt, until P/E
ratios reach an extreme, the trend is as important as the
level.
During secular bull markets, P/E ratios expand and during bear markets,
they contract. Therefore, what is considered "cheap" during a bull
market is not the case during a bear. As the market currently remains
in a secular bear phase, the P/E ratio is in a contraction mode. And it
is likely to keep contracting until it reaches that 6-9 range, which is
a ways off.
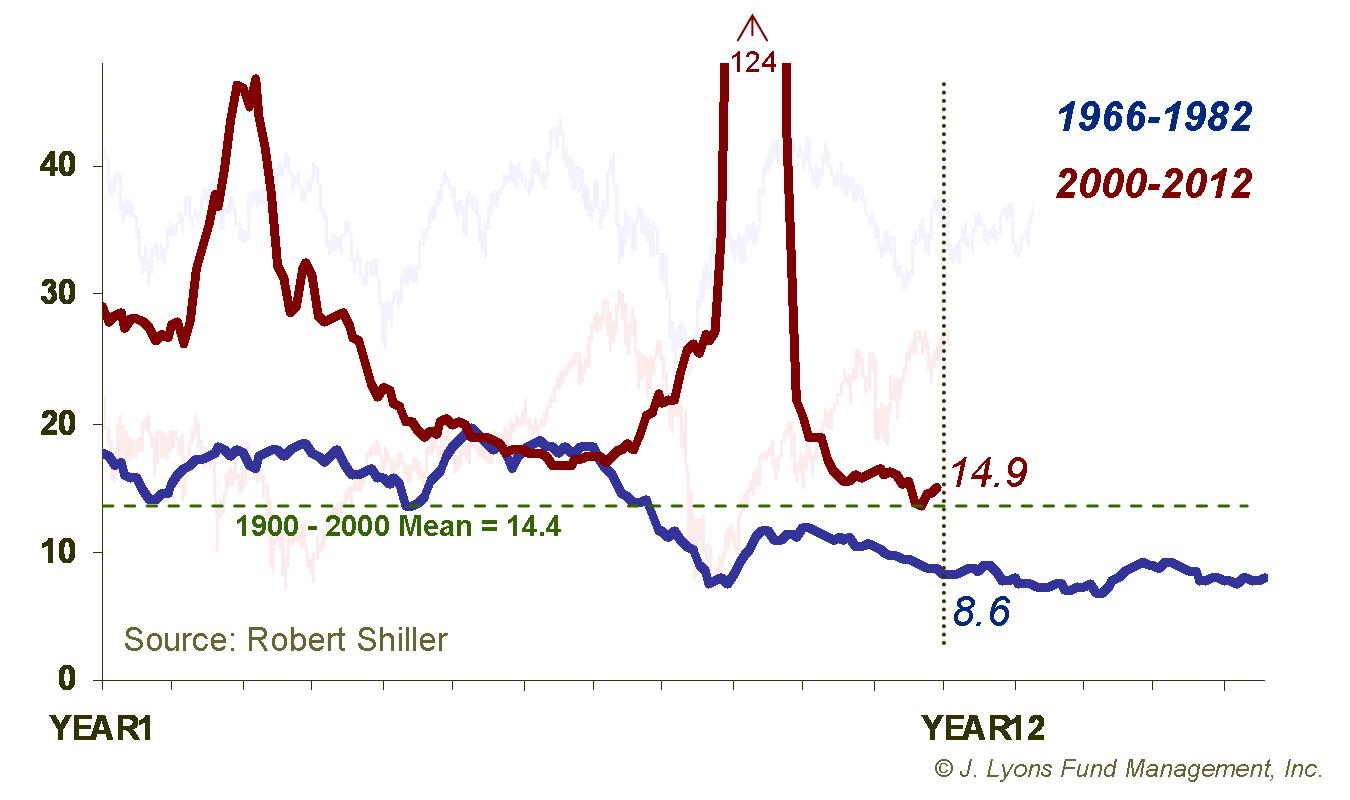
At around 15, the current P/E ratio is not only above the
level that has marked the end of secular bear markets, it is actually
slightly above the mean ratio
from 1900-2000. Though during the 1966-1982 bear market, P/E ratios did
not have as far
to drop as in the current bear, they had already reached the 6-9 level
at a similar juncture. So while the P/E ratio has come down quite a bit
from its elevated level at the 2000 market top, there is still much
more repair work to be done. And since corporate earnings (E) have
bounced respectably considering the feeble economy, the lowering of the
P/E ratio from this point may come more from a decline in the market
price (P).
Other measures of valuation in need of repair: price/book value, dividend yield, stock market capitalization as % of GDP
Investor Behavior
As we have said in the past, probably the most illustrative chart in examining secular stock cycles is the percentage of household assets invested in stocks. This chart reveals a lot of information not only about the level of household investment in stocks but also the psychology and behavior of investors during secular bear (and bull) markets.
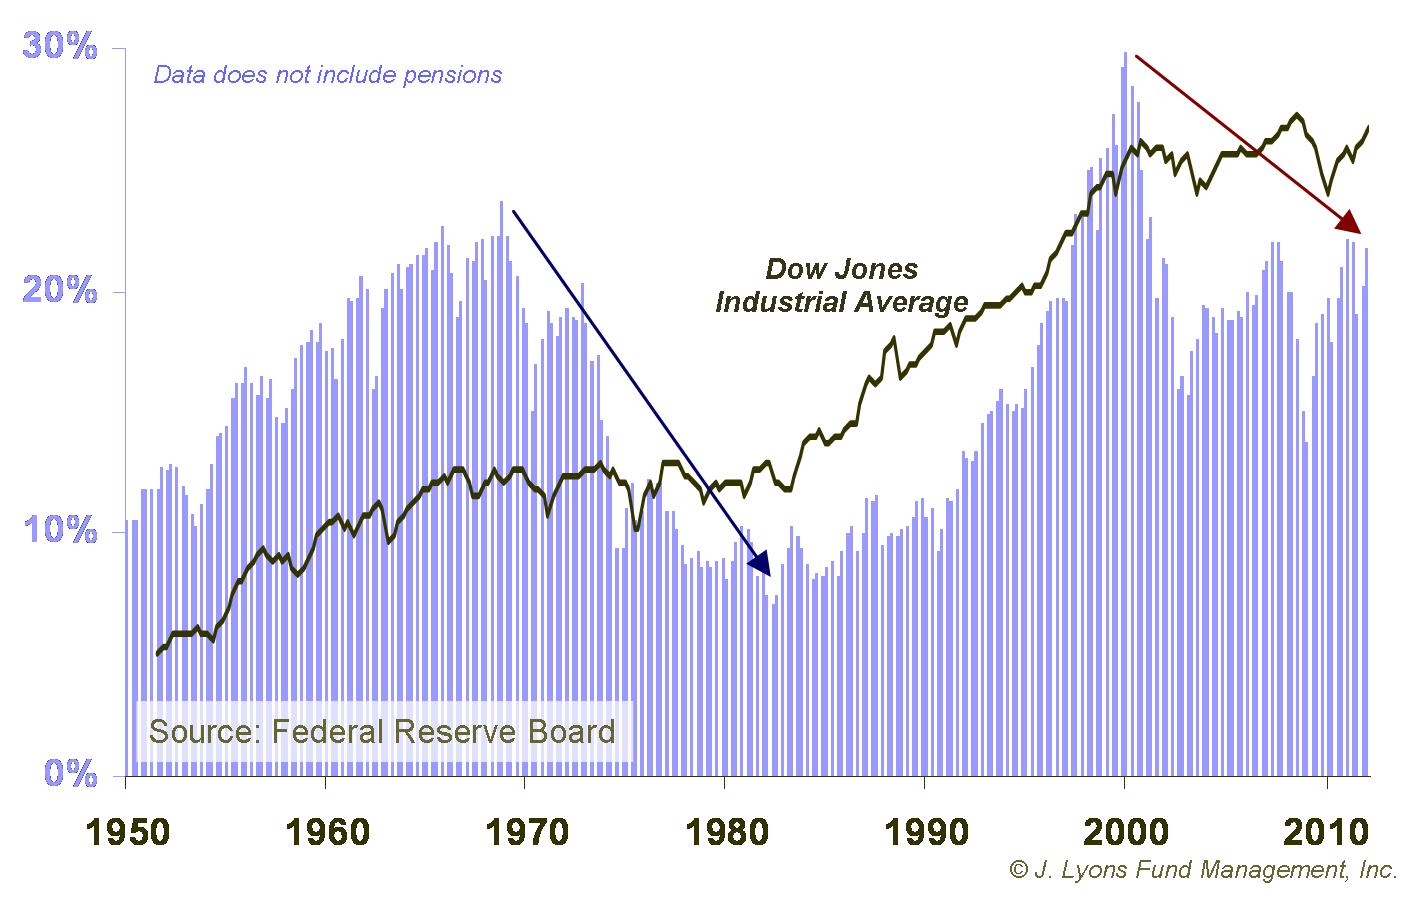
Like the P/E ratio, the % of household assets invested in
stocks has been a consistent marker at turning points in the secular
cycle. Peak levels of household assets invested in
stocks came at the very top -- and very end -- of secular bull markets
in 1966 (a slightly higher level was reached in 1970) and in 2000. Yes,
the high
levels of investment can be attributed to market appreciation to an
extent.
However, much of it is attributable to investor psychology, i.e.,
greed, as by far the biggest flows into stocks came near the secular
tops.
Conversely, the lowest percentage of household assets invested in stocks, about 7%, was recorded in the 2nd quarter of 1982, just as the 1966-1982 bear market was ending. Again, this was not simply a matter of market depreciation cutting into investor assets. The market had actually been some 40% lower at one point in the mid-1970's. The extremely low level was evidence of the frustration and the fear component of human nature in investing. Investors were exhausted by the long, sideways market and had all but sworn off stocks by the time the bull market began in 1982. That is an example of an area of excess being repaired during a secular bear market, clearing the way for a new bull market to begin.
Compared to the 1966-1982 period, the current secular bear market still has a ways to go in working off the excess of households' stock investment.
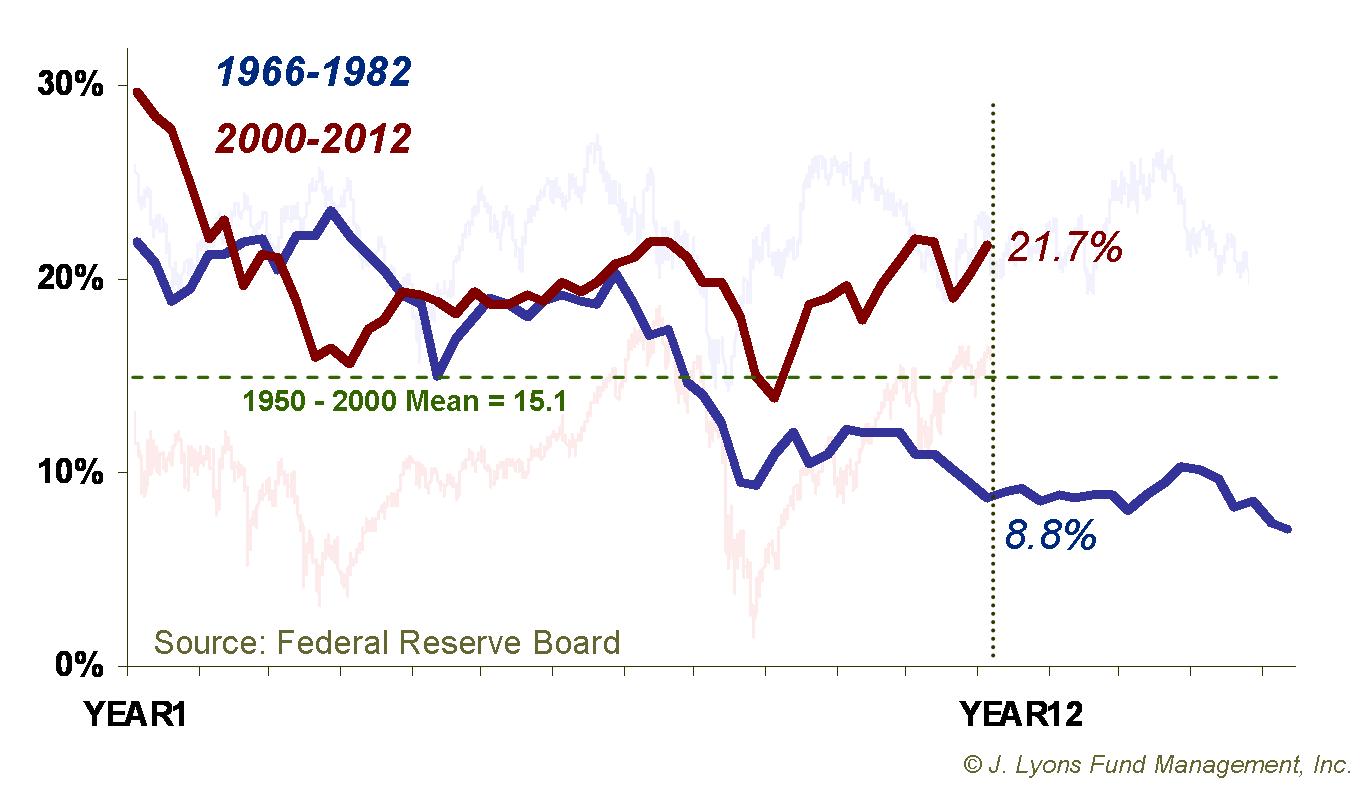
Household stock investment has come down from the peak near
30% of assets in 2000 to around 22% currently. However, that is well
above even the mean from 1950-2000 of 15.1%. Plus, as we have discussed
before, when indicators reach an extreme during one part of
the cycle, they often go to opposite extreme
during the next phase of the cycle. Therefore, we can expect that
the percentage of household assets in stocks will eventually approach a
level closer to the 7% range again before a new secular bull market
kicks off.
Other areas of investor behavior in need of repair: % of mutual fund assets in cash, margin debt
Conclusion
The existence and behavior of the secular stock market cycle has been well documented by us and others. Consistently, the market experiences alternating secular bull and bear markets, each lasting 15-20 years. The bull phases are characterized by economic expansion, increased leverage and rising stock investment and valuations. Once these factors reach levels of unsustainable excess, the bull ends and the bear phase begins during which the excesses are worked off, or repaired. Then the cycle can repeat.
To reiterate: the key in bringing an end to the secular bear phase is that the excesses are repaired. There is no magical time-based force which guarantees that after 18 years of a bear market a new bull market must commence. The conditions to support a bull market must first be put into place. 12 years into the current secular bear market, the necessary repairs are sorely lacking, particularly when compared to prior secular bear markets. This suggests that the remainder of this secular bear -- 4-8 years based on the historical pattern -- will quite likely be weaker than even the lackluster back ends of previous bears.
In our January Newsletter, we discussed the action of the previous two secular bear markets (1929-1949 and 1966-1982) at similar junctures as the present. While those bear markets were each flat over their remaining 4-8 years, the worst of their bear market losses were behind them. Coincidently, each of their worst drawdowns over their last 4-8 years was a 61.8% retracement of the rallies off of their bear market low point. Those retracements did represent 30-40% losses, but at least their bear market lows were not approached.
The 61.8% retracement support level may not hold once the next corrective phase of this bear market hits. Currently, that level on the S&P 500 is around 975 (61.8% retracement of the 2009-2012 rally from 666 to 1475). A drop to that level would be a loss of about 34%.Considering the amount of repair still needed in order to put an end to the current secular bear market, steeper losses than that are certainly a possibility at some point. As unlikely as it seems, the possibility that the 2009 lows will be approached before this bear market ends cannot be dismissed.
Dana Lyons
The
commentary
included in this newsletter is provided for informational purposes
only. It does not constitute a recommendation to invest in any
specific investment product or service. Proper due diligence should be
performed before
investing in any investment vehicle. There is a risk of loss involved
in
all investments.
| Tweet |
|