J. Lyons Fund Management, Inc. Newsletter
| August-September 2014 |
Posted September 30, 2014 |
| Tweet | 
|
 |
Good News & Bad News
Despite rising equity prices, the economic landscape is less than stellar.
Like the economy, the investment climate this year has been a challenge. Taking clues from our stock market risk quantifying model, certain technical factors and the less than impressive economic recovery here in the U.S. as well as around the world in general, it has proven dificult to capture the returns that, in retrospect, have been offered in stocks (at least through the 3rd quarter). We know that much of the cause for this extended bull market that we have witnessed has been that the excess money that the Fed has so liberally dispensed in order to keep the economic ship afloat has had no place to go except the stock market. There has been little demand for borrowing and the bond market has little appeal with interest rates close to zero for short term returns. That’s the paradox that we find perplexing. The economy is so fragile that it needs to be on Federal Reserve life support and yet the resultant stock market bias is positive. In fact, the market often goes up when bad economic news is announced because that apparently means that the Fed dares not to remove the ventilator (a.k.a. fiscal stimulus).
In actuality, the Fed’s wide open spigot of money flow that has ended up in stocks has had significant negative consequences. Ten percent of the populace own 90% of the stocks and it is projected that 95% of the wealth that has been thus created has accrued to the sometimes maligned upper 1% of income earners. That is but one of the major reasons why the disparity between upper and middle to low income individuals is widening. The others are the real unemployment rate and the lack of confidence in the policies from Washington. All this contributes to the tentativeness of businesses and, therefore, the tentativeness of our investment stance.
Disclaimer: While this study is a useful exercise, JLFMI's actual investment decisions are based on our proprietary models. Therefore, the conclusions based on the study in this newsletter may or may not be consistent with JLFMI's actual investment posture at any given time. Additionally, the commentary here should not be taken as a recommendation to invest in any specific securities or according to any specific methodologies.
What
It Looked Like To Us
Let’s look at a few reasons why our projections of a suspect economy were appropriate despite the fact that certain elements were and are proclaiming nothing but blue skies. First let’s look at the number of unemployed versus the total population: The President declared just last week here in Illinois that “every economic metric was better now” than when he took office. Yet in this very State, there are 300,000 fewer employed persons than in 2008 – and that, as can be seen in the chart below, does not tell the whole story as it doesn’t consider the growth of the population. Moreover, in Illinois, there are twice as many food stamp recipients as new jobs created since 2008.
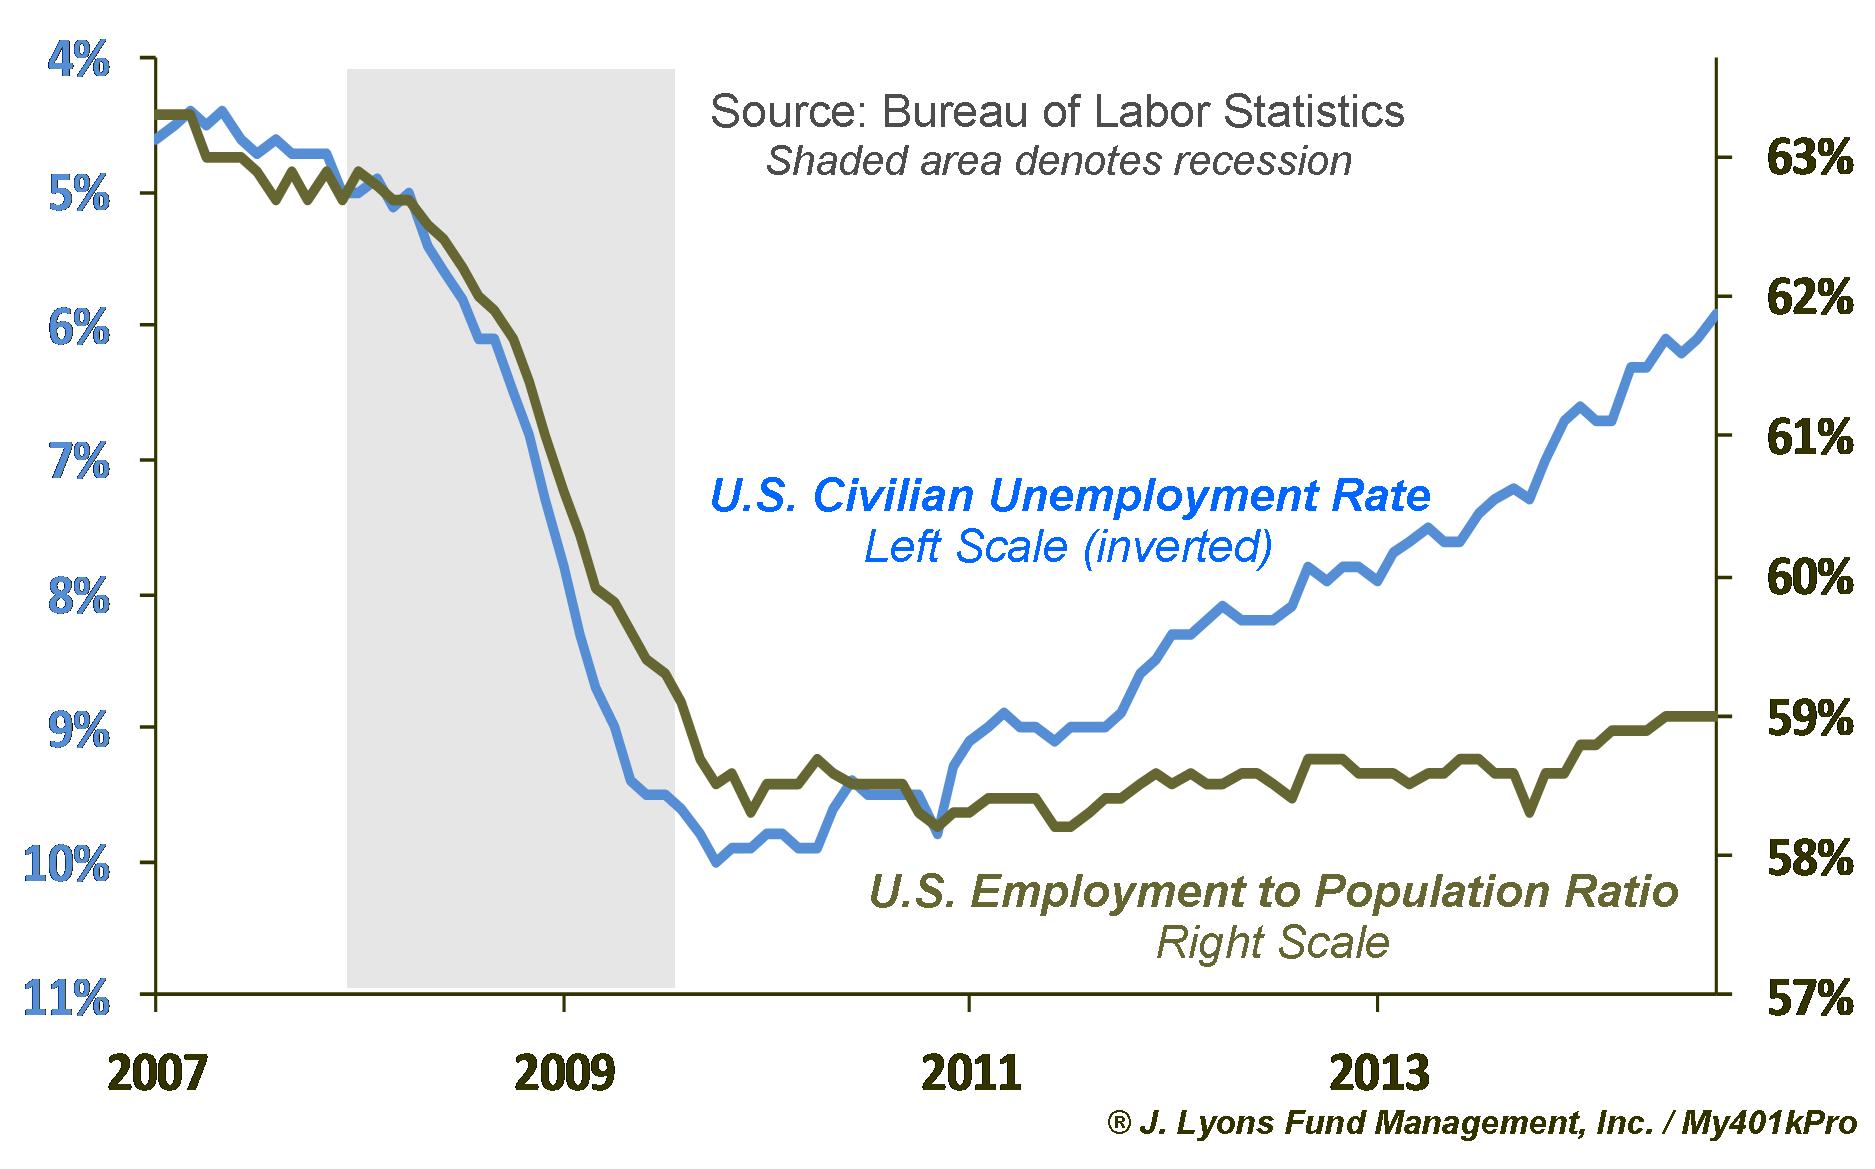
To suggest our employment picture is
better off than it was in 2008 is simply folly. Ask the millions who
are unemployed but not in the statistics being highlighted by the
government.
Confidence
vs Conned-fidence
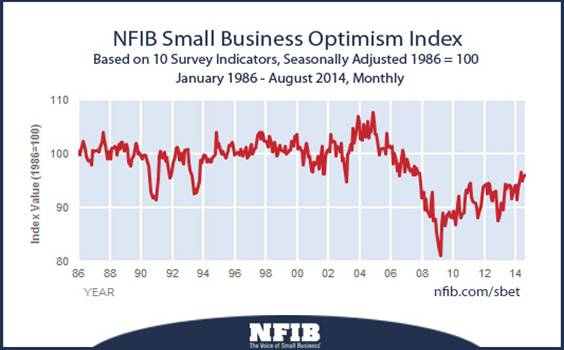
Recently I heard it asserted by the White House Press Secretary that small businesses were now reflecting great optimism about their prospects. In fact, the August (most recent) update of NFIB’s Small Business Optimism Index shown below indicates otherwise. Their accompanying survey to this chart noted that more business owners think that business conditions will be worse in 6 months than now and also that the consensus was that this is not a good time to expand.
Even a cursory look at the chart below shows that despite some improvement, the current barometer of small business people is still at the lows that have occurred during previous recessions. It is a deceptive and premature stretch to interpret the findings as positive. It may be less negative but optimistic in the light of its history, it is not.
How
About Big Business Confidence?
To be sure, company profits have risen over the past few years but where are these profits being spent? It certainly doesn’t appear that they are spending it on things that will aid their growth down the road. See chart below regarding capital expenditures by corporations.
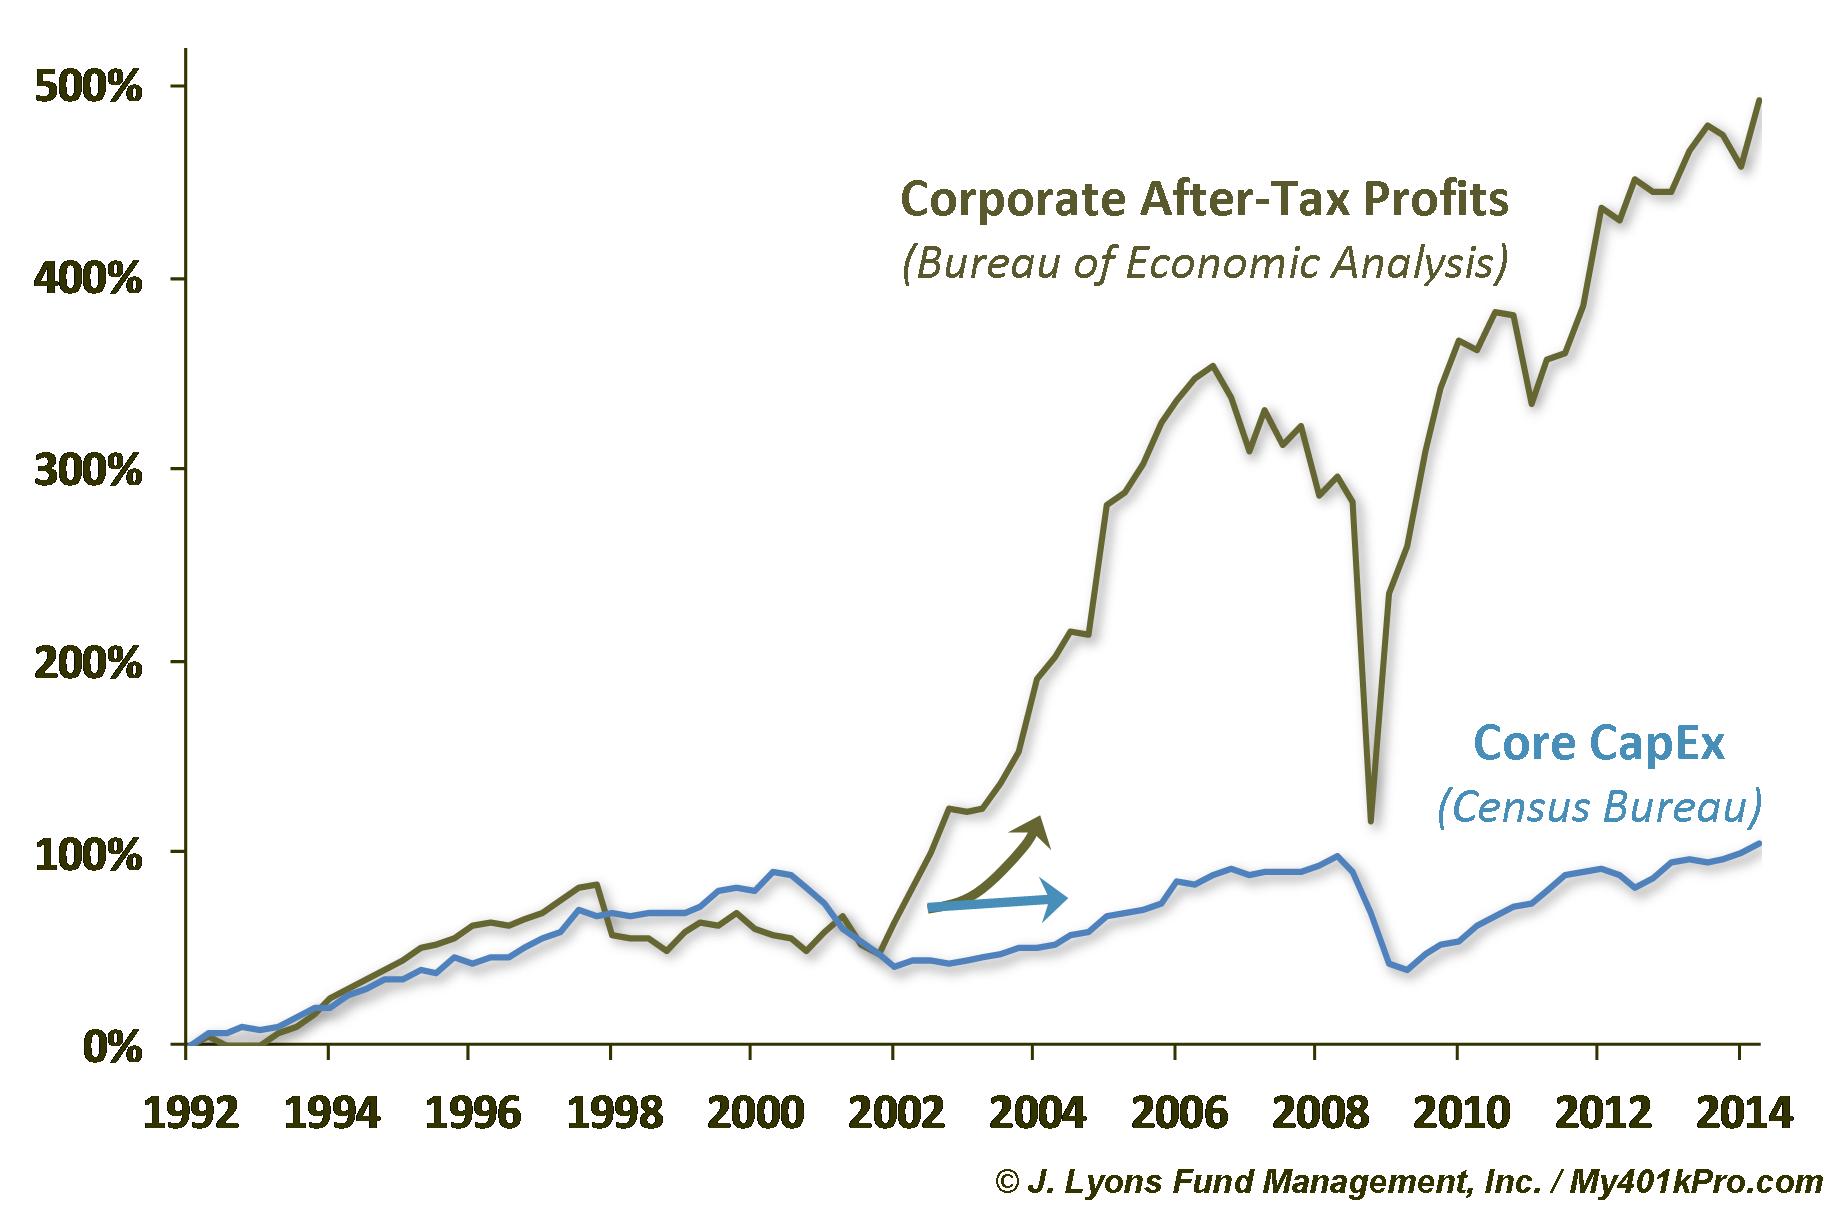
For
one example, a recent Wall Street Journal report stated “The Federal
Reserve today reported corporate cash balances spiked to $1.93 trillion
– a 38% increase since the first quarter of 2009 – representing $530
billion.” This significant increase indicates companies are still
accumulating cash rather than redeploying it, according to Treasury
Strategies, a treasury consulting firm.
In addition to hoarding cash, corporations are spending near record amounts to buy back their own stock. Corporations bought back $338.3 billion of stock in the first half of the year, the most for any six-month period since 2007, according to research firm Birinyi Associates.
Not only do
these statistics suggest that corporations are skeptical about putting
their money to work in this environment for the purposes of chancing
that a more growth-friendly climate is on the way, they also suggest
that these stock buybacks have contributed to the support of the market
as it attained heights that we view as overdone.
We think that it is of note that in the second quarter, U.S. stock-market volume averaged 6.03 billion shares a day, the lowest level for the period in seven years, according to Credit Suisse Group. Add the fact that high frequency trading can comprise 40% or more of all equity trading volume and you can easily conclude that of the normal (non-high frequency) trading, the amount of buyback purchasing might have supplied a significant amount of buoyancy to the stock market as statistics show that companies did their buying back into any weakness.
Are We There Yet?
Now let’s look at how our fellow citizens are faring? We all know how student loan debt has overtaken credit card debt and that the massive amount of such loans is an inhibitor to business creation, household formation, home buying, etc., etc. -- i.e., consumption in general. Forty percent of recent college graduates are either unemployed or under-employed and, much to their dismay, one in three is living back with their parents.
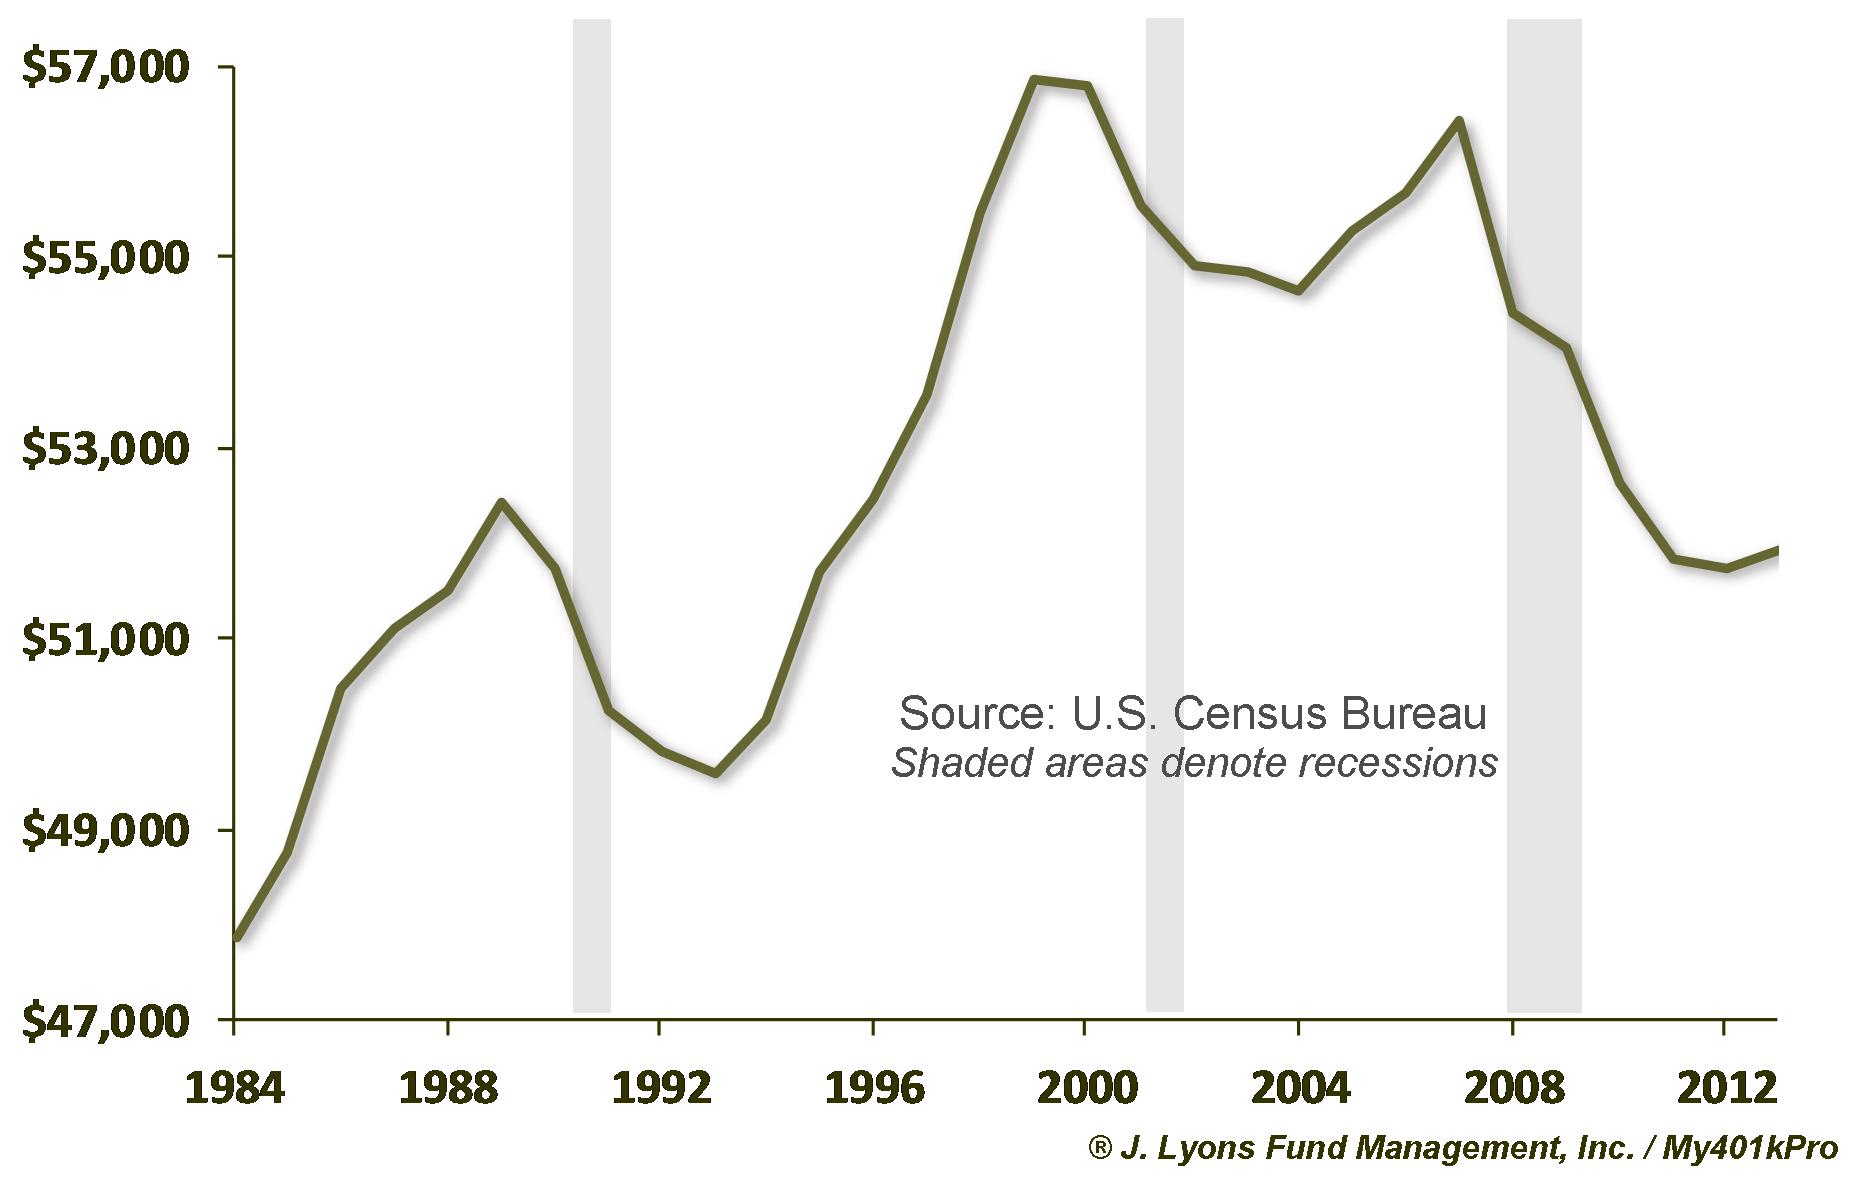
A lack of income has the same effect as does an overload of debt, that being a drag on the economy. The chart below is but one more metric that has continued to deteriorate since its last peak in 2007. This lack of growth in household income continues to be an impediment to the economic recovery from the Great Recession. Furthermore, when you consider that the lack of wage growth does not factor in the depressing fact that so many long-term unemployed folks are not even experiencing any wages, let alone a dismal wage growth, it is even more disconcerting.
So...
How does all this relate to investment performance? The answer is that, by itself, it doesn’t. However, accompanied by what the rest of the world is doing economically and especially by the fact that our Risk Assessment Model has been in high risk territory for the majority of the past 2 years, as risk managers we have been inhibited in our inclination to be as bullish as a retrospective tells us we should have.
In defense of that Risk Assessment Model that has been so effective for the past 40 years, its warning signs had us reducing our exposure from approximately a 75% position to a slight inverse position (one that profits as the market declines) over the past few weeks. The good news is that we have avoided much of the decline and in fact made slight profits over the very recent past. The fact that our model gave a warning signal almost at the very top of the market is quite interesting and quite unusual although it does reflect the fact that it has been signaling substantial risk for some time as we have said. As such, it didn’t take much to move us into a complete Sell Signal.
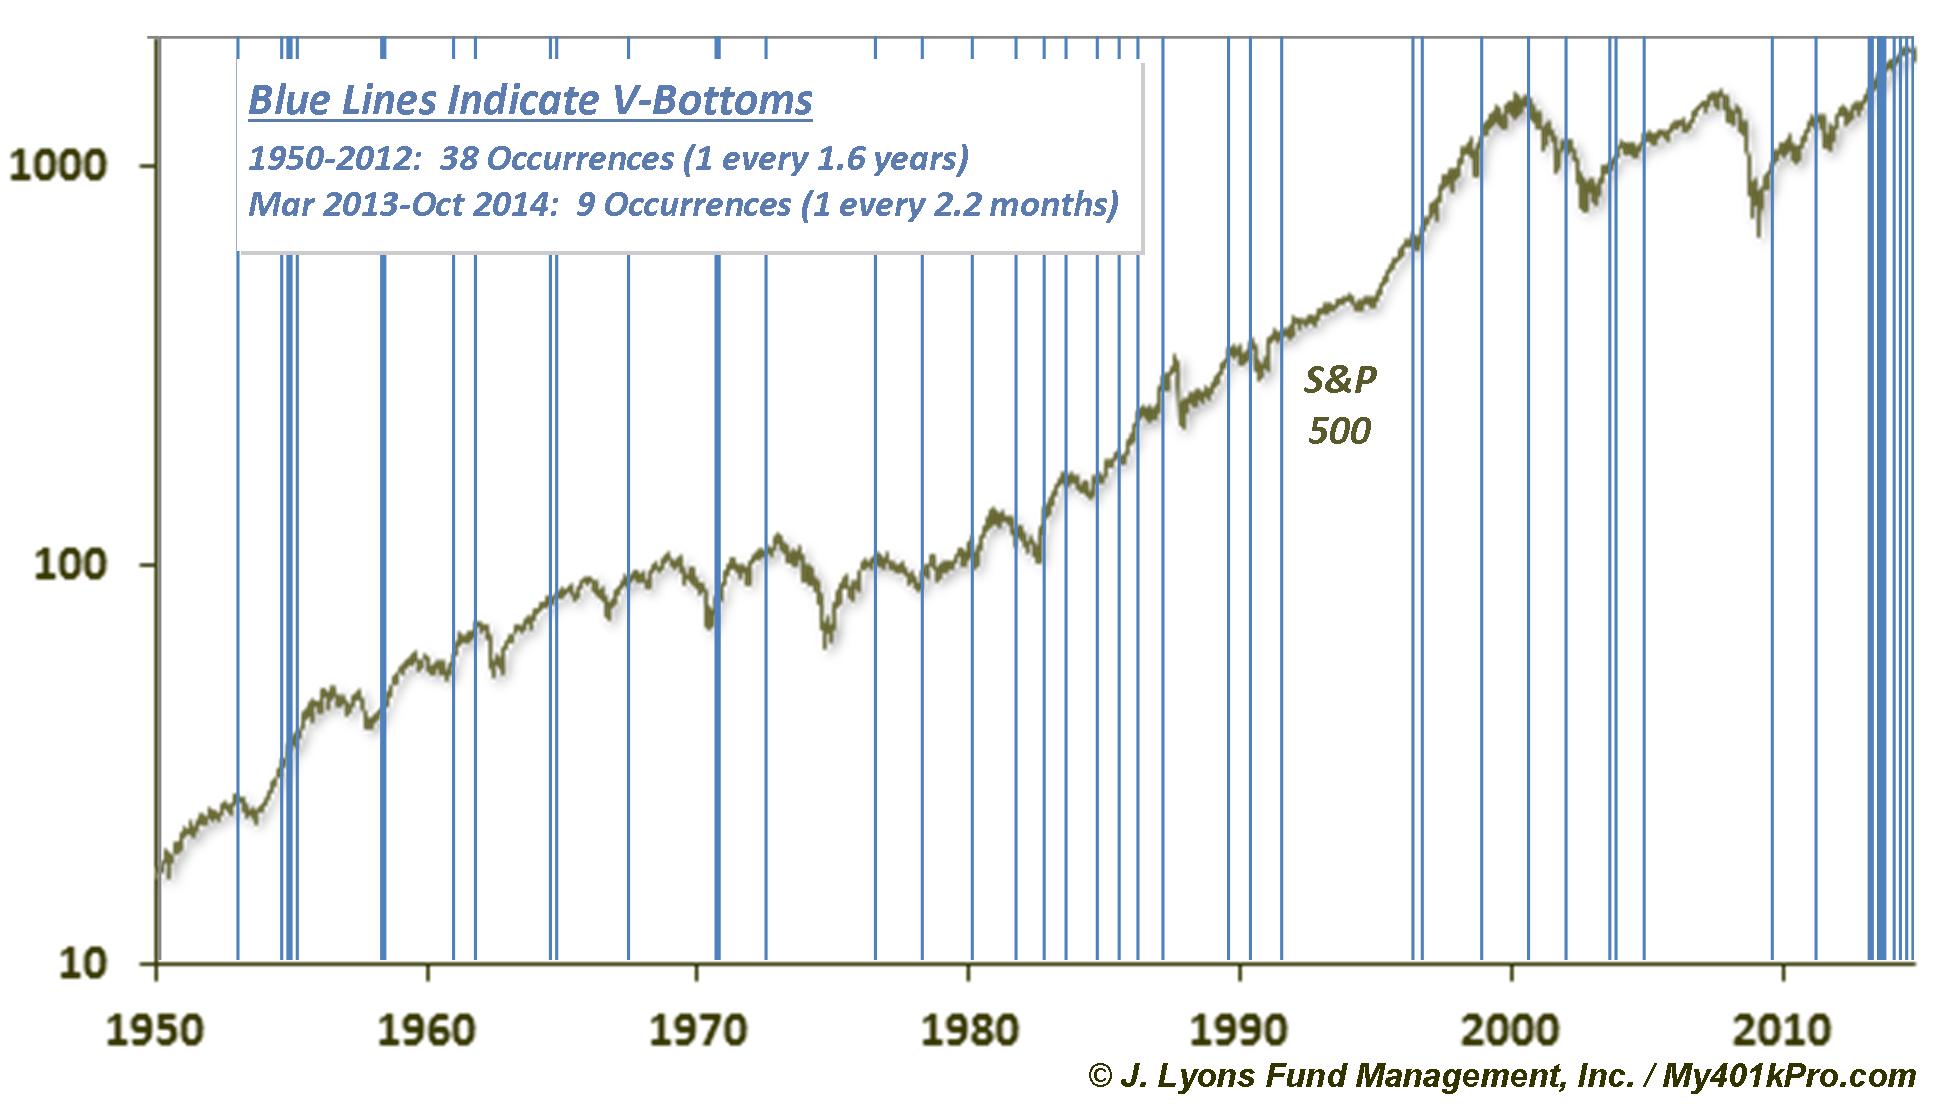
However, once again, could this decline culminate quickly in what we call a V-shaped bottom? See the V-Shaped bottom study below. At this point, we are not placing bets on that as there is too much evidence that this decline is a bit more sinister than those of the past two years. However, with interest rates remaining low and the stock market still being the only place for certain investment funds as well as the fact that stock buybacks can offer at least some support, I suppose another such quick turn-around could be in order.
 Of course that would once
again ignore the sluggish and now faltering economy here and abroad.
However, at some point, unless the current policies from our leadership
and that of Europe changes resulting in renewed confidence, the
disproportionate move in the stock market will end. The lack of
business confidence as well as the reality of this fragile recovery
will then have its impact on the markets. We don’t know when or whether
that will occur but we endeavor to be ready for whatever might happen
just as we are now.
Of course that would once
again ignore the sluggish and now faltering economy here and abroad.
However, at some point, unless the current policies from our leadership
and that of Europe changes resulting in renewed confidence, the
disproportionate move in the stock market will end. The lack of
business confidence as well as the reality of this fragile recovery
will then have its impact on the markets. We don’t know when or whether
that will occur but we endeavor to be ready for whatever might happen
just as we are now.
An
Anomaly?
Our goal as always is to protect clients' assets. We view the recent economic and market environment as an anomaly as history shows us no parallel. Anomalies, by their very definition have limited lives and we believe this one is on borrowed time. We know that in investing markets, action inspired by impatience – exuberant or fearful – is always the wrong course to follow. Impatient though we – or you – may be, we plan on following the lessons that we have learned over the entire 45 years of daily market watching and studying rather than just the past 2.
- John Lyons
President
The
commentary
included in this newsletter is provided for informational purposes
only. It does not constitute a recommendation to invest in any
specific investment product or service. Proper due diligence should be
performed before
investing in any investment vehicle. There is a risk of loss involved
in
all investments.
| Tweet |
|
|