J. Lyons Fund Management, Inc. Newsletter
| May/June 2013 |
Posted June 12, 2013 |
| Tweet |
 |
All In
Those awaiting a boost once retail investors come back into the stock market are either ignoring the data or applying the wrong context. The reality is that retail investors are about as "in" as they're likely to get.
A frequent refrain from the bull camp is "what happens to the rally when the retail investor comes back?" The suggestion is that the risk in the stock market is still to the upside as, according to those making the argument (the entire sell-side community?), retail, aka individual, investors represent a large pool of potential new buyers should they decide to return to the market. It is an iteration of the "cash on the sidelines" argument. We would argue that the real risk is "what if the retail investor is already back?"
Perhaps the most deleterious flaw among many professional money managers is the failure to identify, or even attempt to identify, the greater, secular environment in which they are operating and its implications on market moves. All too often, we come across market research based on short-sighted analysis or inappropriate context. For example, take the bulls' argument that equity valuations are substantially more attractive than they were 13 years. Of course they are -- 2000 was the peak of a raging secular bull market! That is why, in order to ensure the validity of a comparison, we always emphasize the importance of using periods at similar junctures in the market cycle.
The point is that investment behavior is not static. It varies depending on the market environment, sometimes slightly, sometimes significantly. Price patterns change, indicators behave differently and what is considered "extreme" is redefined. And as investment behavior changes, one's investment process must be dynamic. The parameters one uses to gauge investment opportunities need to be correctly adjusted to fit the environment.
So how does this pertain to current individual investor behavior? We believe that those making the argument that individual investors have yet to return to the market are using the wrong parameters as their basis. In our view, not only have individual investors returned to the market, but they are invested at levels that, in the context of the current environment, are arguably extreme. They are certainly high enough to justify the formation of a cyclical top. Furthermore, data pertaining to recent investment behavior on the part of individuals including flows into the stock market and other speculative activity has reached levels that can be considered extreme in any context. Sadly, it appears that so-called "retail investors" -- moms and pops, wannabe-retirees, income investors deprived of legitimate income-producing alternatives and every little guy reeled in by the propaganda of the investment "establishment" -- are once again moving all of their chips in at the worst possible time.
Let's look at the evidence.
Disclaimer: While this study is a useful exercise, JLFMI's actual investment decisions are based on our proprietary models. Therefore, the conclusions based on the study in this newsletter may or may not be consistent with JLFMI's actual investment posture at any given time. Additionally, the commentary here should not be taken as a recommendation to invest in any specific securities or according to any specific methodologies.
Retail Investor Equity Allocation at Relative Extremes
What those who are arguing that the retail investor has yet to return to the market are missing is environmental context. Investors behave differently during a secular bear market than they do during a bull market. In a secular bull market, equity allocations trend upward over time. Conversely, during a secular bear market, investors undergo a deleveraging, or de-risking, process. As the bear market unfolds, investors' equity allocations trend downward, resulting in lower highs and lower lows. Thus, equity allocations should not be expected to reach previous peak levels as long as the secular bear remains in force.
U.S. HouseholdsIllustrative of this pattern is the following chart from the Fed's Flow of Funds report showing the percentage of households' financial assets that are invested in stocks.
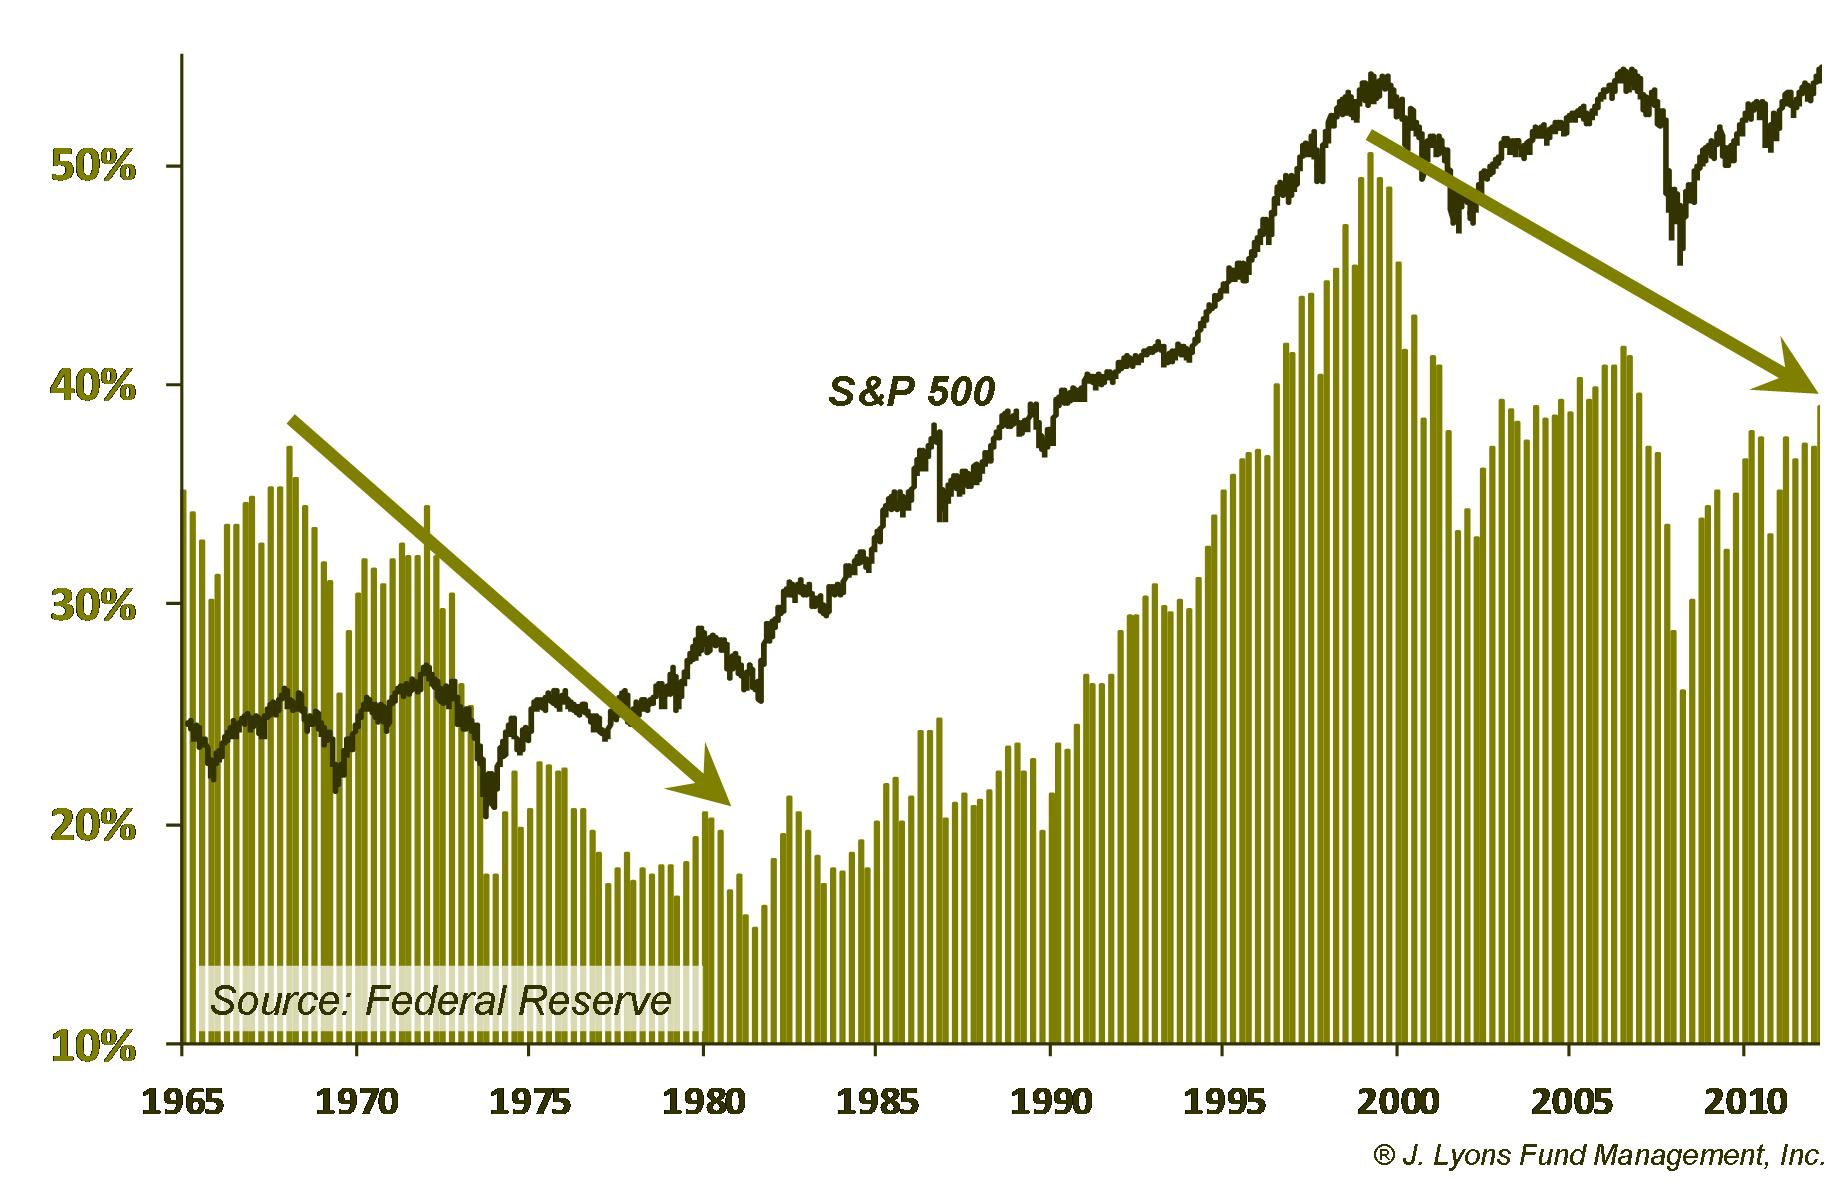
This is a revealing
chart because it illustrates the psychological toll taken on
investors during secular bear markets. Notice how during the 1966-82
secular bear, household assets in stocks trended downward even as the
stock market, overall, moved sideways. The repeated cyclical declines
within the secular bear led to more and more distrust on the part of
investors. Each advance in the market resulted in lower peaks in
household investment and each decline led to lower lows. By the time the secular bear ended in 1982, households had
an all-time low 15% of their financial assets in the stock market.
The same pattern has unfolded during the current secular bear market. While the market has basically gone sideways since 2000, the nasty cyclical declines in 2002 and 2008 have led to a declining trend in household stock investment. After reaching an all-time high of just over 50% in 2000, subsequent peaks in stock investment have fallen well short of that level, as to be expected. To use the 2000 level of household stock investment as the basis for considering individual investors to be "back in the market" would be a contextual mistake. They are already back.
Consider the bounces in household stock investment that coincided with the cyclical rallies during the past two secular bear markets.
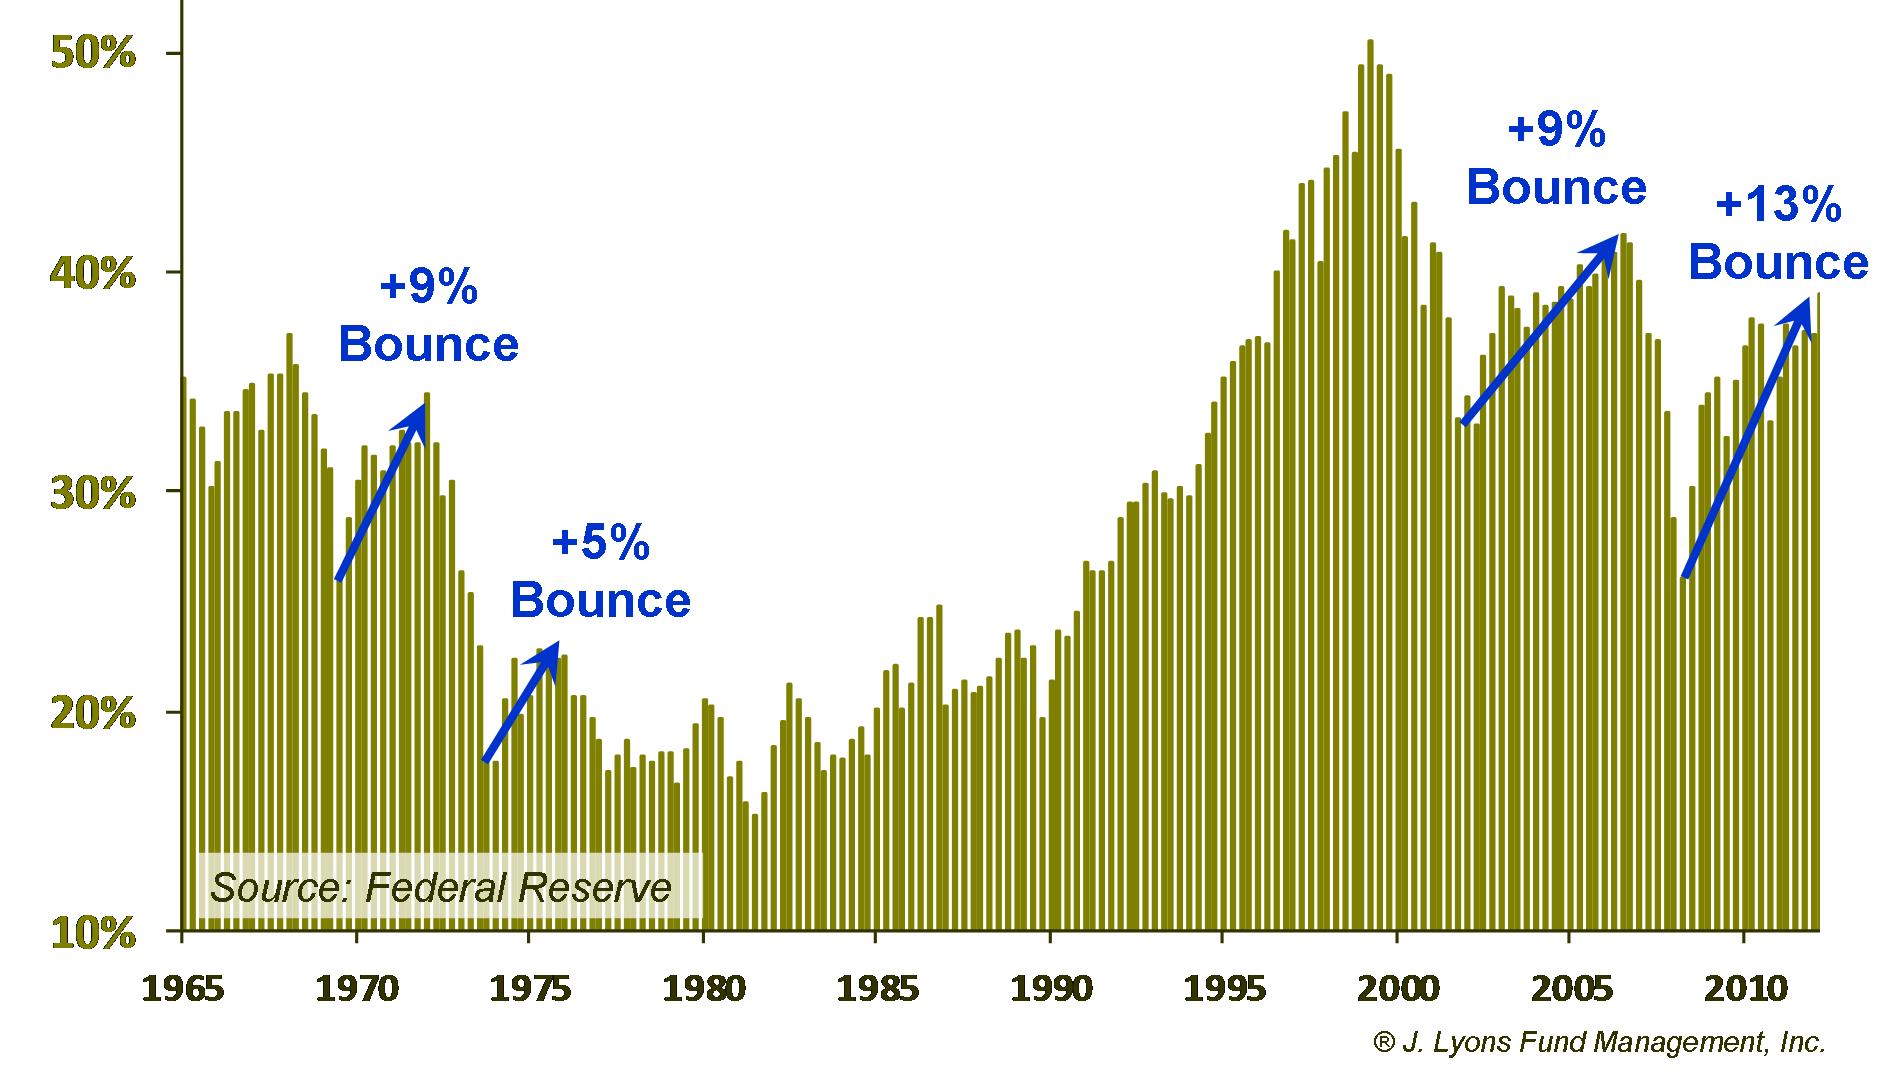
The
1966-82 bear saw bounces in stock investment of 9% and 5% during the
rallies that peaked in 1973 and 1976, respectively. During the 2002-07
rally, household stock investment rose 9%. Currently, stock investment
is up 13% from the 2009 lows after jumping 2% in the 1st quarter of
2013 alone. Households are clearly back in stocks to the extent than
can be reasonably expected given the environment. Can the investment
level go even higher? Of course. But to make the argument that
these investors are not back would be going against the evidence, or
taking it out of context.
The same pattern is seen with respect to stock allocations in 401(k)'s. In data collected by Aon Hewitt, the downtrend in stock allocations is evident as the secular bear market has unfolded.
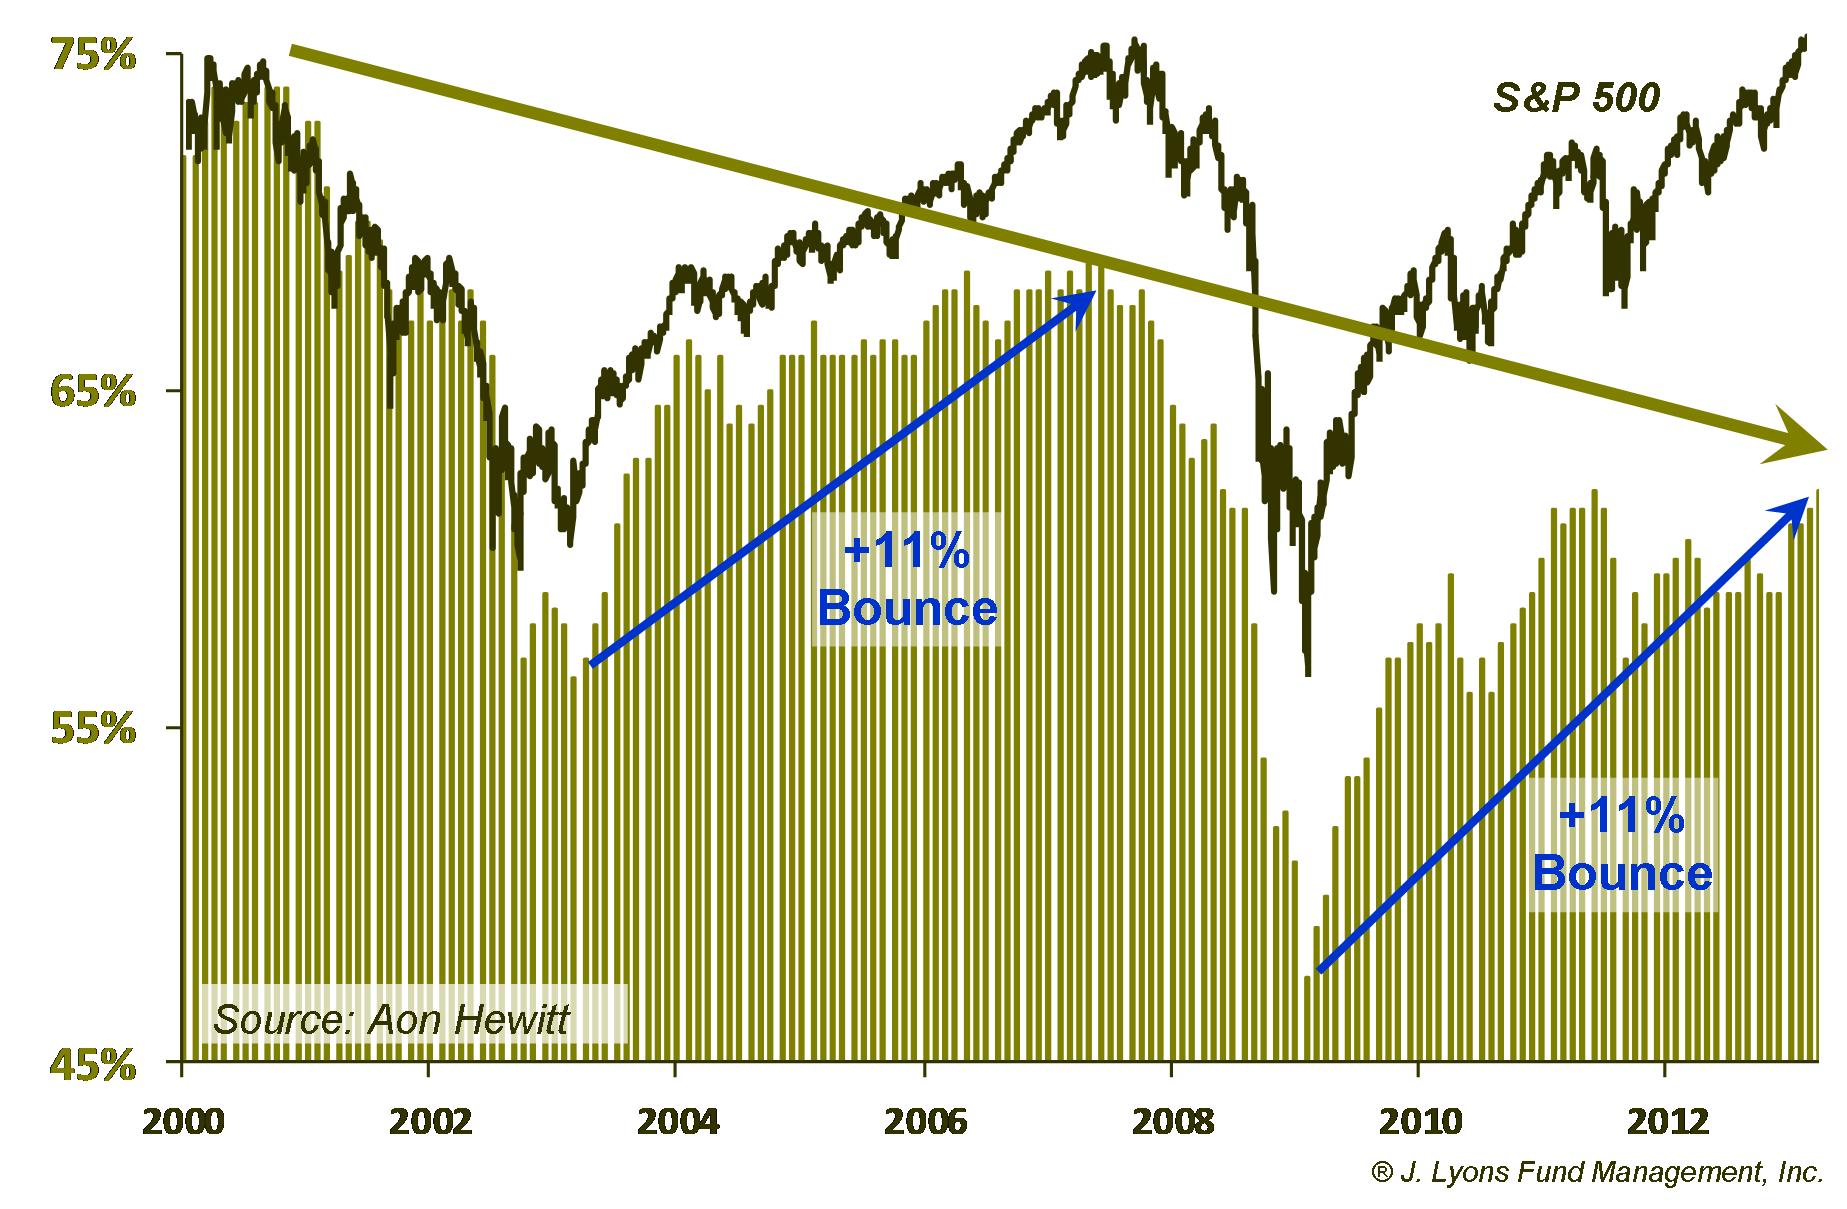
After
also reaching a peak at the very top and end of the 1982-00 secular
bull (no surprise there), the subsequent tops in 401(k) participants' stock investment have
come at lower levels whereas the stock market has moved generally
sideways. This again is likely a reflection of the growing disenchantment with
the stock market after having to endure
two brutal cyclical bear markets. Unfortunately, mirroring the peak
allocations at the market top, most of the reduction in stock
investment came near those bear market lows in 2003 and 2009.
Currently, the data is at a cyclical high-mark, having risen 11% from
the lows in 2009. Notice the same 11% rise in stock allocation from the
2003 low to the 2007 high. The evidence is again clear: viewed in the
proper context, the 401(k) investor is also back in the stock market.
Lastly, we see the same general pattern in the widely followed asset allocation survey produced by the American Association of Individual Investors (thanks to sentimentrader.com for the chart).
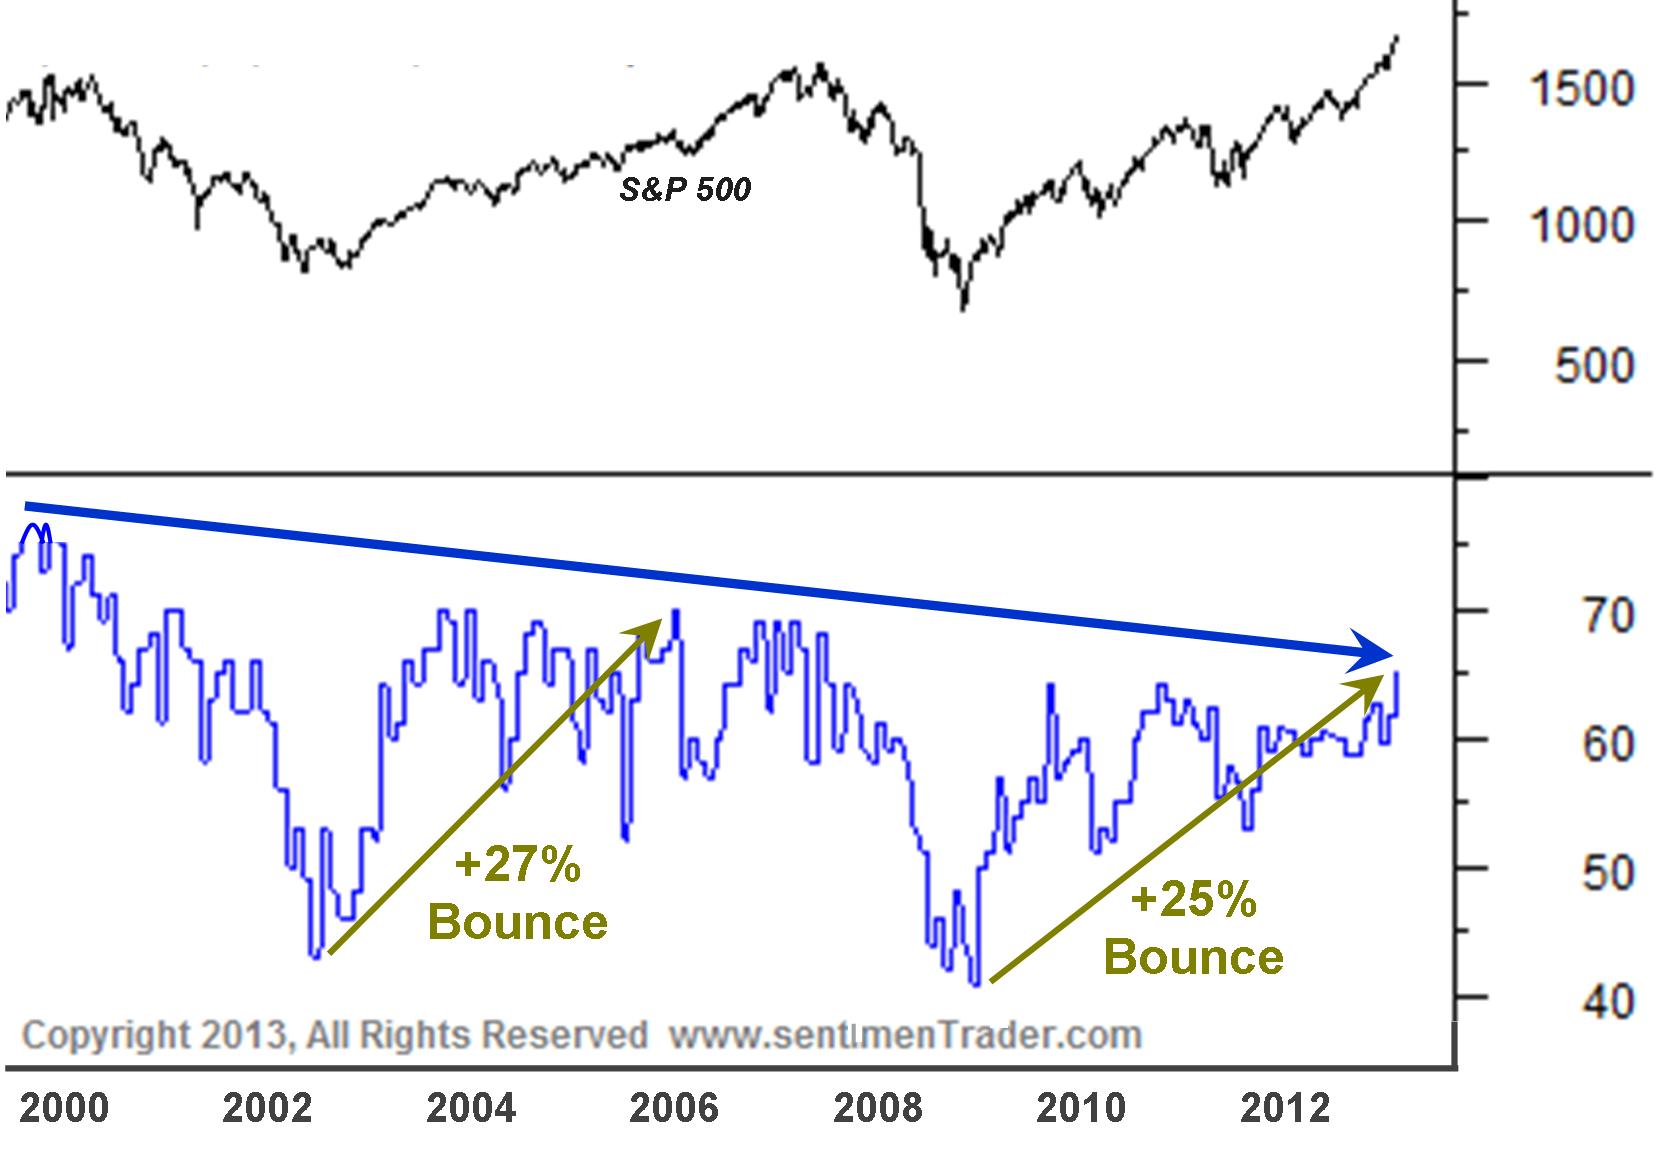
After reaching a record high of over 75% in 2000, individual
investors' allocation to stocks has trended downward throughout the
course of the secular bear market, making lower highs and lower lows
along the way. The peak allocation during the 2003-07 rally was lower
than in 2000 and we would expect stock allocation during this rally to
top out even lower. Therefore, there is not a lot of room for
allocations to increase from here. And considering the substantial
increase in stock allocation from their 2009 lows, of
approximately the same magnitude as the 2003-07 bounce,
individual
investors are as "in" the stock market as they need to be in order to
form the next cyclical top.
Recent Stock Inflows and Speculative Behavior at Elevated Levels
In addition to the gradual increase in retail investors' allocation to stocks to what is now a relative extreme, there are a growing number of examples of recent investor behavior that are absolutely extreme in any context. Unlike the allocation data which provides a broader view of the investment situation of individuals rather than a precise signal to take action, this recent behavior is typically more timely in warning of elevated risk. And while these warnings may often pertain to shorter-term risk, when combined with investor stock allocations at relative extremes, they paint an ominous longer-term picture as well.
Investment Flows into Stocks
Like many variables related to trend-following, it is beneficial to have investment flows (i.e., money going into or out of a security or asset class) to be going in the direction of the trend, until it reaches an extreme. When flows become extreme, it is an indication that a trend has become widely recognized and that all of the potential participants have piled in. At that point the trend is vulnerable to a reversal because, remember, the crowd is always wrong at the extremes.
Investment flows into stocks have been largely restrained since the cyclical rally began in 2009, a condition which actually has allowed for such a prolonged advance. That restraint came to an abrupt halt during the first quarter. Investors poured money into stocks at a torrid pace, indicative of a late-trend buying spree. Consider the following alarming statistics:
- According to Trim Tabs, U.S. stock mutual funds received a record $77.4 billion of inflows in January, $23.7 billion higher than the previous monthly record set in February 2000
- According to Trim Tabs, U.S. stock mutual funds received a net $52 billion of inflows in the 1st quarter, the highest amount in 9 years
- According to Strategic Insight, the combined net inflow into stock and bond categories of ETF's and mutual funds combined was $246 billion in the first quarter, $73 billion more than the previous record set a year earlier
- According to Aon Hewitt, 401(k) investors moved $1.19 billion into diversified equity funds during the first quarter, the highest amount in their data's history (back to 1997)
It is possible that the increase in equity inflows during the first quarter was partially related to late 2012 selling due to fears of capital gains tax hikes. We don't think that was a big factor, however since A) the data from the 4th quarter 2012 does not show evidence of a wide scale exodus out of equities and B) only the "sell" decision really should have been significantly impacted by the tax fears, not the "buy" decision. Furthermore, the 401(k) data validates the notion that the record stock inflows in the 1st quarter were due purely to investor demand since tax considerations are not relevant in those accounts.
Speculative Activity
Finally, let's look at data regarding some of the more speculative activities that investors can engage in. First off is margin debt. Buying on margin basically means you are borrowing money to buy more stock than you have cash to buy. There is hardly anything more bullish, or speculative, that an investor can do than borrow money to buy stocks. And as with other investment behavior, the higher the level of margin debt, the more susceptible the market is to a decline. That's not merely because it is symbolic of investors appearing to be so bullish. It is also because, mechanically, there is a lot of borrowed stock that needs to be sold. That condition exists at the present time.
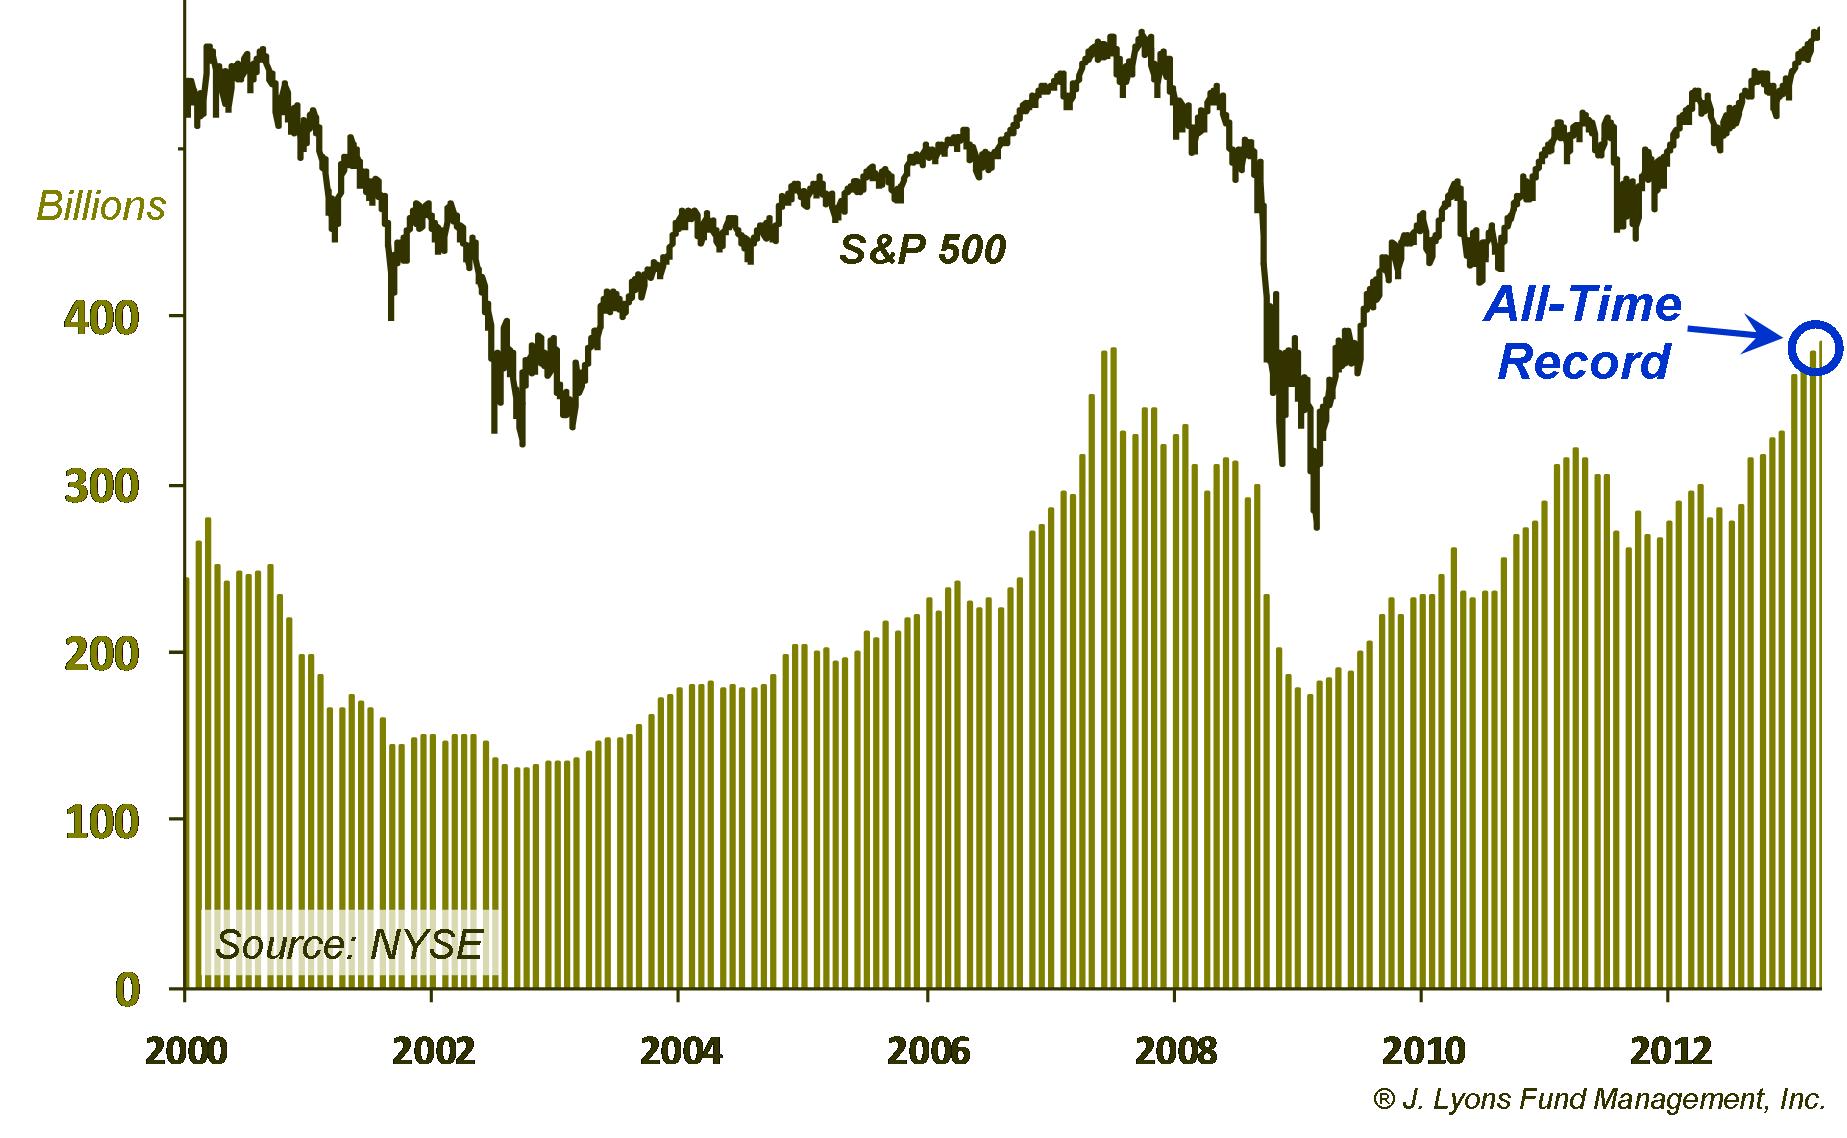
NYSE margin debt hit a new all-time
high in April, slightly exceeding the previous peak which coincided
with the top in 2007.
Some argue that the absolute level of margin debt is
irrelevant because the available free cash in investors' accounts needs to
be netted out. First off, netting out the free cash still results in a level of margin debt that was surpassed only at the
highs
in 2000, by a small amount. Second of all, we'll leave it to readers to
reach their own conclusion from the above chart. We think it is pretty
clear.
The last example of the recent ramping up of speculative behavior that we'll touch on is in the area of Over The Counter Bulletin Board stocks, or penny stocks. These are stocks that trade at very low prices, e.g., for pennies. The low prices are well-deserved as these are the lowest quality in terms of tradable companies. For the most part, these penny stocks are very risky as they are pretty much worthless. Once in a while though, an investor -- or more accurately, a speculator -- can earn a huge return on a very small investment if they happen to pick a penny stock that goes up significantly.
To put it another way, these stocks are basically the lottery tickets of the stock universe and represent the most speculative of all investments. Therefore, when trading activity within penny stocks is active, it is a sign of an elevated speculative environment. As one might have guessed, that is the case now.

In fact, as with much of the data we have presented, it is extremely
elevated. In May, the dollar volume traded in penny stocks jumped over
200% from the April level and almost 600% above the average of the past
12 months. It was the highest dollar volume since the penny stock
frenzy in 2000. So not only are retail investors back in stocks, but
they are engaged in the most speculative areas of the market, and to an
extreme.
Conclusion
We often emphasize that, when making stock market comparisons, it is important to look at historical periods at similar points in market cycles. This holds true when analyzing investor behavior. Investors behave differently in different market environments and, thus, the indicators and parameters used to measure such behavior must be adjusted to allow for accuracy of analysis. Over the course of a secular bear market, investors take a gradual deleveraging or de-risking path with their stock investments as they become more disenchanted with stocks the longer the secular bear persists. Their allocation to stocks still oscillates along with the cyclical ups and downs of the market. However, each cyclical market top brings a lower peak in allocation and each market low, a lower trough.
A common theme among Wall Street pundits has been that the long-awaited return of the retail investor to the stock market will provide the fuel for the next up-leg of the post-2009 bull market. However, these pundits are either failing to properly identify the present secular bear market environment or failing to properly adjust their parameters to accurately analyze behavior in this environment -- or both. We see no evidence, despite the marginal new highs in the stock averages, that the secular bear market has ended. Given that, all the evidence points to the fact that the retail investor has already returned to the stock market, at least to the extent that we can reasonably expect them to return. Investor allocation to stocks, by all measures, has now rebounded since the 2009 lows to a degree on par with historical secular bear market bounces. Moreover, despite the new highs in the averages, investors' allocation to stocks is now making a slightly lower peak than in 2007, as should be expected in this environment.
So not only are retail investors back, but their level of stock investment is suggestive of a cyclical market top. The recent inflows into stocks and rapid acceleration in speculative behavior only reinforce that conclusion. Unfortunately, after missing out on much of the rally in stocks, it appears that once again investors are putting their investment chips "all in" at the wrong time. If you are tempted to go all in with your retirement funds, no-interest earning savings or any other investments, we strongly suggest you seek out an advisor or manager with an active risk-management strategy to assist with your decision. Market tops are typically drawn-out processes so you may well still have a small window of time. However, once a bear market hits, it usually hits fast and your "chips" could be gone in a hurry.
Dana Lyons
The
commentary
included in this newsletter is provided for informational purposes
only. It does not constitute a recommendation to invest in any
specific investment product or service. Proper due diligence should be
performed before
investing in any investment vehicle. There is a risk of loss involved
in
all investments.
| Tweet |
 |

