J. Lyons Fund Management, Inc. Newsletter
| October/November 2012 |
Posted November 28, 2012 |
| Tweet |
 |
Danger: Thin Market
Underlying conditions supporting the cyclical rally are melting away, leaving the market vulnerable to collapse.
“The last thing to collapse is
the surface."
- Albert Einstein
Winter is knocking on the door here in Chicago and, global warming fact or fantasy aside, chilling temperatures are looming. In the market, but for the brief spell of "May showers", the post-2009 cyclical bull market has continued its steady ascent this year. Yet, many of our recent newsletters have been written with a decidedly cautionary tone (with the notable exception of the October 2011 issue published around the market lows a year ago.) So why the caution? Are we just crying wolf? After all, Larry Fink, CEO of Blackrock, the largest asset manager in the world, recently recommended that investors have 100% of their money invested in stocks. And the esteemed Wharton professor, Jeremy Siegel, among others, has called the current stock market one of the most attractive that he has ever seen. Since the market has continued to rally this year, aren't they right and aren't we wrong?
First of all, as we indicate in our disclaimers, the content contained within our newsletters "may not be consistent with JLFMI's actual investment posture at any given time." In fact, our clients' investment allocation may be completely contrary to the theme of our newsletter at that time. For example, we may have our clients' accounts fully invested in stocks even as we are writing a cautionary report on the market. This is because we employ an Active Management strategy using quantitative models to guide our investment decisions based on the current market data. We don't rely on subjective forecasts, no matter our conviction behind them. We also don't simply buy-and-hold. We have a sell discipline as well to warn us when the present risk becomes elevated so that we can take measures to prevent losses when the market drops. Therefore, we can participate in a risky, seemingly baseless, market rally because we have confidence that our tools will get us out when that risk manifests itself.
Secondly, there are many ways to skin a market rally. Just as it is difficult to determine the thickness of a frozen pond by merely looking at its surface, measuring the soundness of a rally requires looking at more than just price. Some rallies are accompanied by significant support from a broad number of individual stocks and other factors. This is the most structurally sound type of rally since it can remain intact even when a few stocks begin to break down. Conversely, "thin" market rallies that rely on only a relatively few number of rising stocks and other supporting factors to drive it are less sound and thus carry more risk of significant losses once they break down. So sometimes a rally is built on solid underlying support and sometimes it is merely setting up market participants for a greater fall when it collapses. To put it another way: would you rather break through the ice stepping off a curb, or 28,000 feet in the air climbing K2?
Here we take measure of the current "thickness" of support under the market to determine the risk below should it collapse.
Disclaimer: While this study is a useful exercise, JLFMI's actual investment decisions are based on our proprietary models. Therefore, the conclusions based on the study in this newsletter may or may not be consistent with JLFMI's actual investment posture at any given time. Additionally, the commentary here should not be taken as a recommendation to invest in any specific securities or according to any specific methodologies.
Layers of Support
The strength of a stock market rally can be likened to the thickness of the foundation supporting a sheet of ice. If the top layer of ice cracks, one will not fall very far if there is a thick foundation beneath it. Similarly, if there is solid support behind a market rally, investors need not fear significant losses should the market suffer a pullback. The level of support behind a market is largely determined by the market's internals, or breadth. This refers, generally, to the number of stocks that are rising versus falling as well as how strongly the stocks are rising or falling. Accurately measure the breadth and you will discover the direction of the overall market. For this reason, much of the construction of our Risk Model is based on breadth measures.
That said, as with a glacier, there may be other layers of external support contributing, albeit temporarily, to the foundation of a market. Typically, if the support of these alternate layers is meaningful, it will be reflected by improved market breadth. However, since these external influences are derived from outside of the actual market, at times they can distort the appearance of strength within the market.
Let's look at the current potential layers of support for this market.
Market Internals
As mentioned above, the main determinant of the robustness of
a
rally is the amount of support from the market's internals, or breadth.
Some rallies are
accompanied by a significant burst in the number of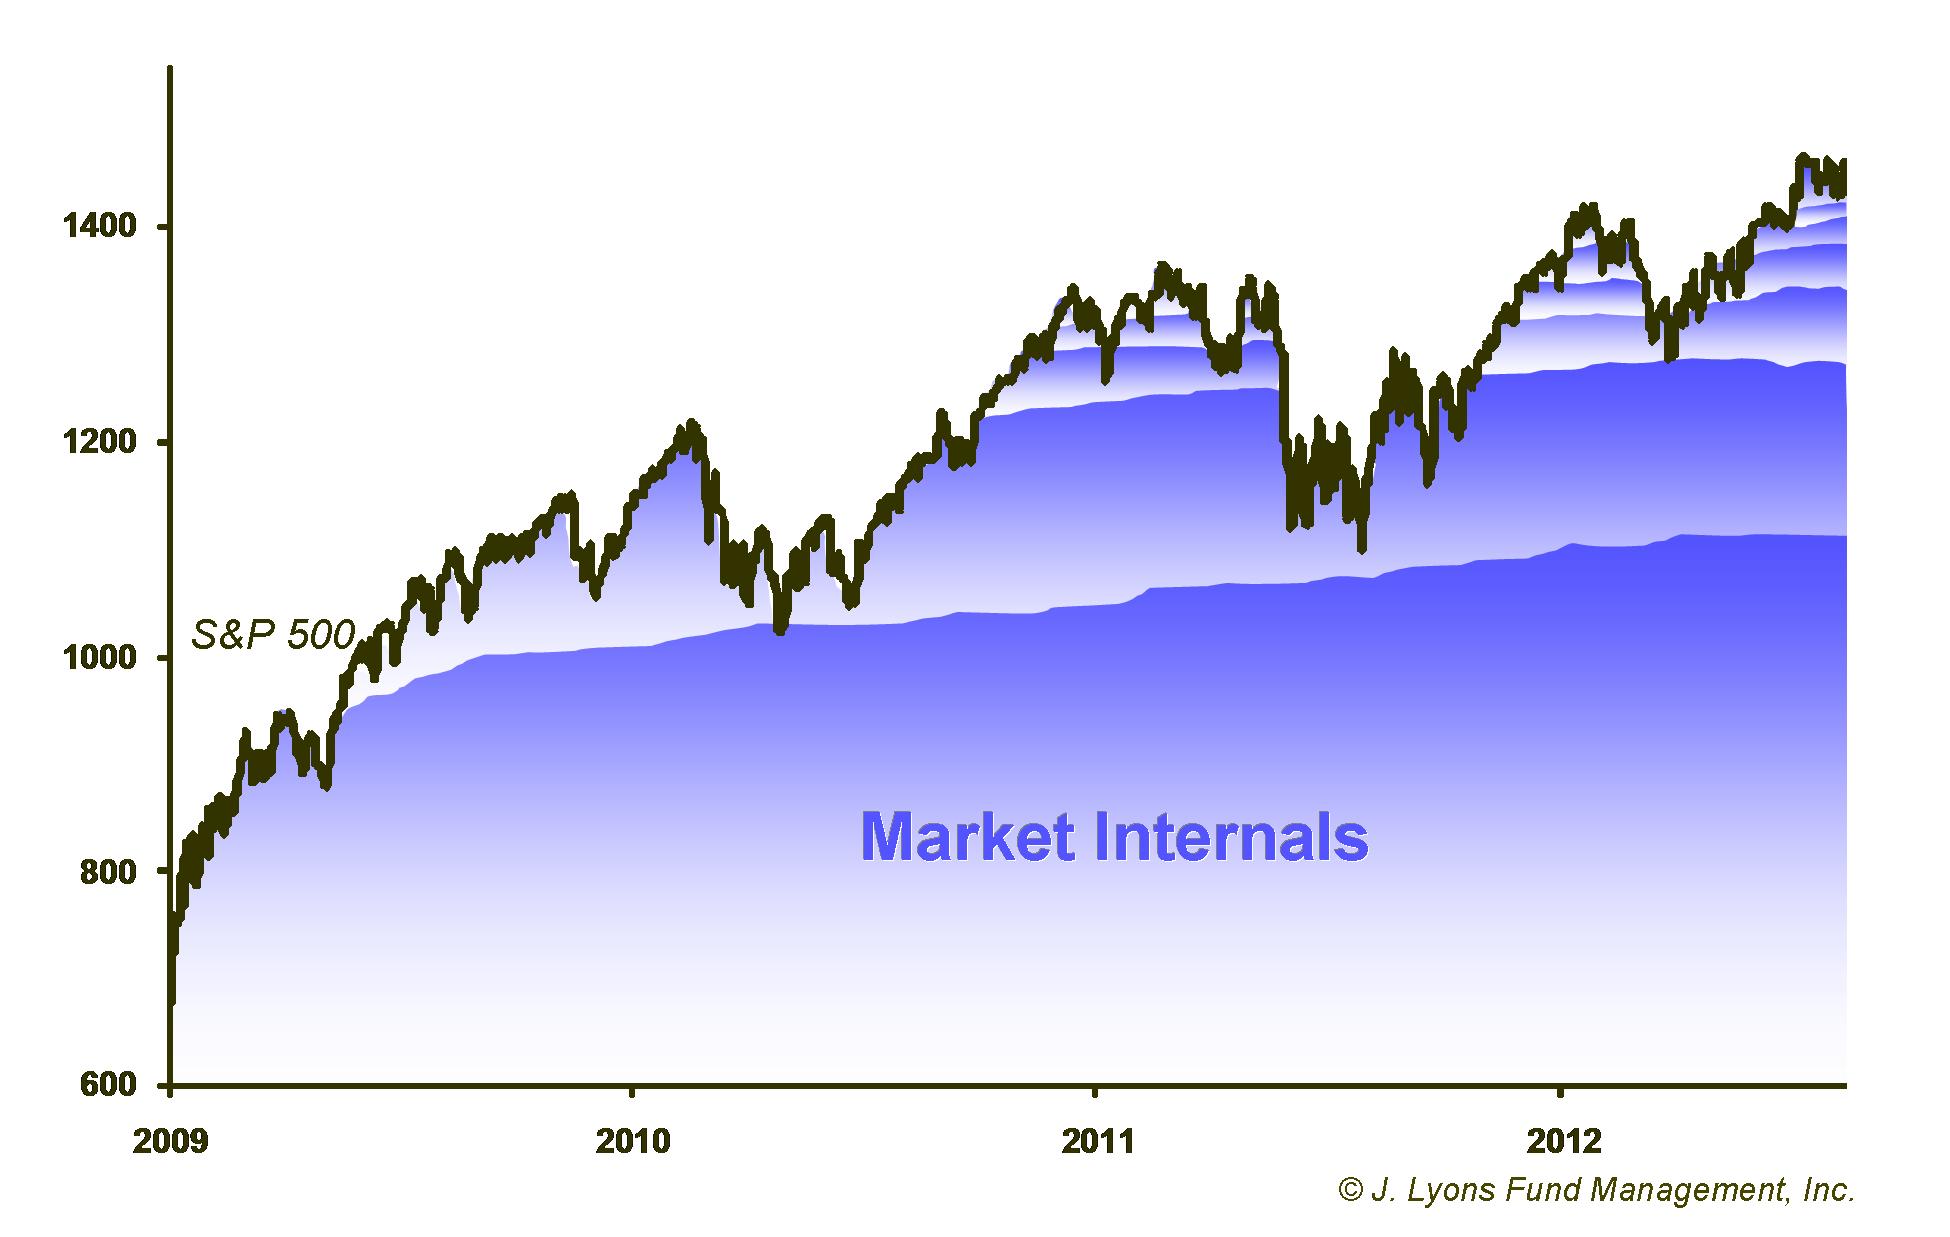 individual stocks
moving higher. This is particularly true early on in cyclical
bull
markets (cyclical bulls tend to last about three years). These such
rallies are preferable since, with so many
rising stocks supporting the rally, it can remain intact even when a
few stocks begin to break down. Additionally, an early-cyclical bull
rally benefits from a great number of stocks having
been oversold.
Thus, once they turn around and begin to move higher they have a lot of
room to run.
individual stocks
moving higher. This is particularly true early on in cyclical
bull
markets (cyclical bulls tend to last about three years). These such
rallies are preferable since, with so many
rising stocks supporting the rally, it can remain intact even when a
few stocks begin to break down. Additionally, an early-cyclical bull
rally benefits from a great number of stocks having
been oversold.
Thus, once they turn around and begin to move higher they have a lot of
room to run.
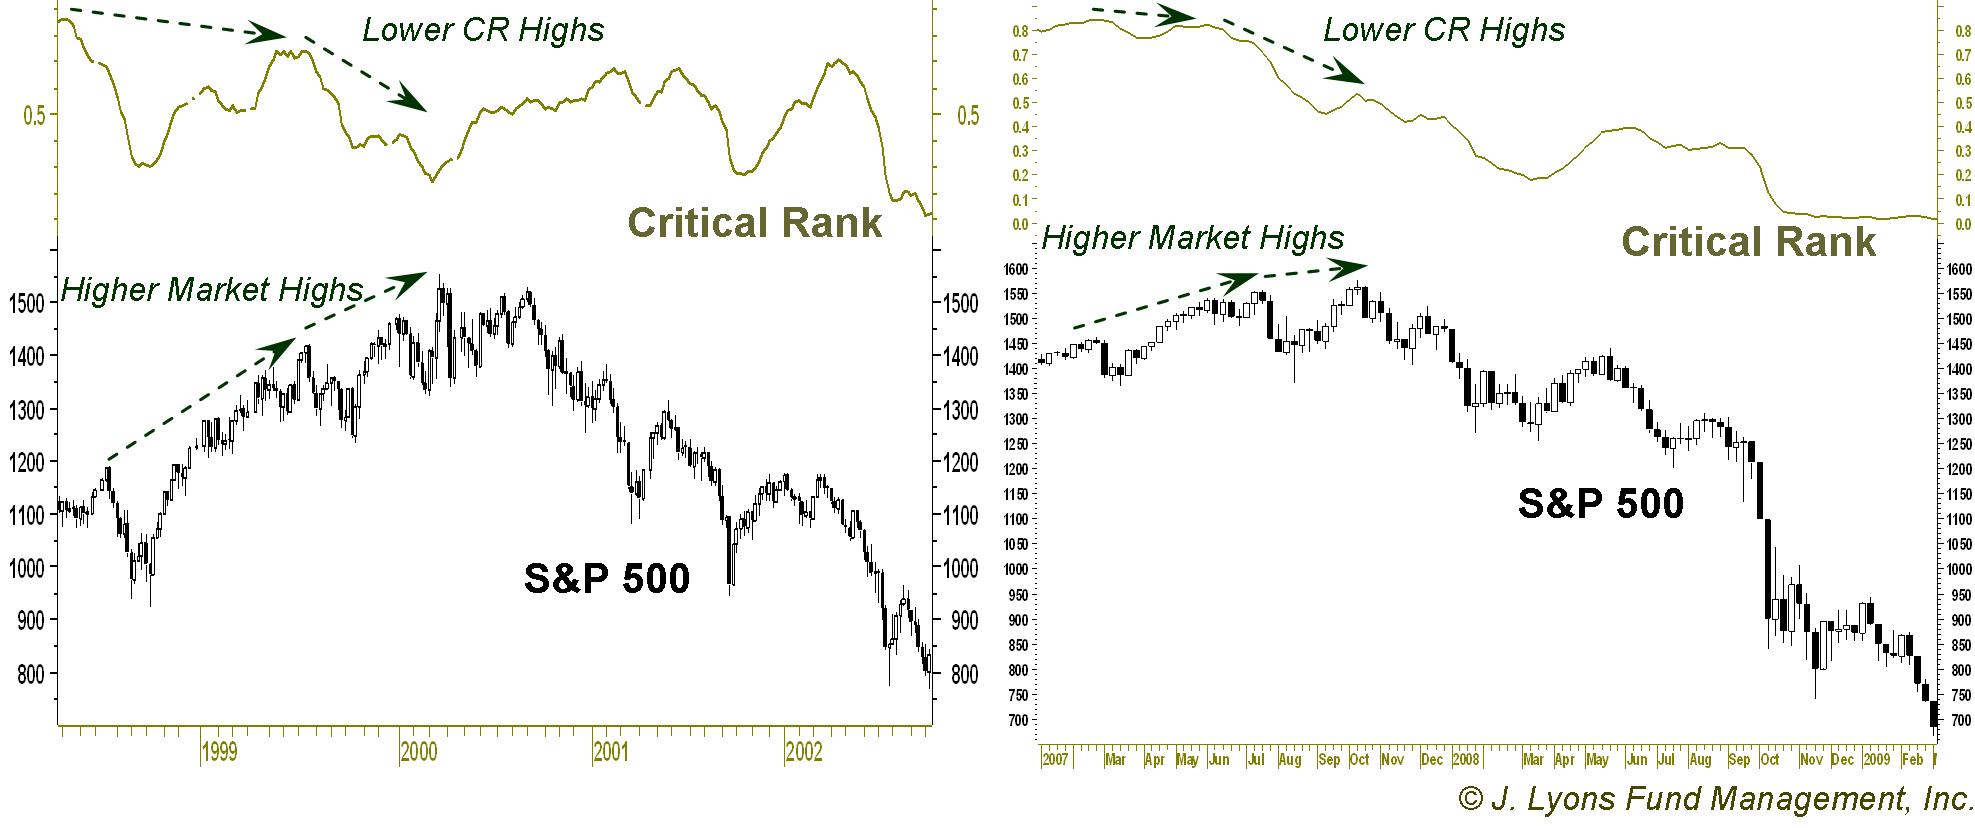
On the other hand, market rallies that rely on only a relatively few number of rising stocks to support it are less sound and thus carry more risk of significant losses once they break down. These "thin" rallies often occur towards the end of cyclical bull markets when many individual stocks have seen their own rallies run their course. As an example, in 1999, the S&P 500 rose about 20%; however, the entire gain was attributed to only a relatively few number of stocks and more than half of the stocks in the index were actually down that year. Indeed, once the S&P 500 rally ended in 2000, it proceeded to lose 50% over the next few years, illustrating the potential risks once a thin rally ends. The resulting declines are deep, swift and difficult to get out of once they begin.
So how does one measure market internals? Much like an investment approach in general, there are really unlimited ways of measuring internals. The indicator below is one example of such a measure, and a relatively rare glimpse into a key component of our Risk Model. The "Critical Rank", as we call the indicator, measures the percentage of stocks within an index (the S&P 500, in this case) showing positive momentum as determined by a quantitative formula. When the Critical Rank is rising, an increasing number of stocks are showing positive momentum, indicative of a structurally sound rally. The opposite is true when the Critical Rank is falling.
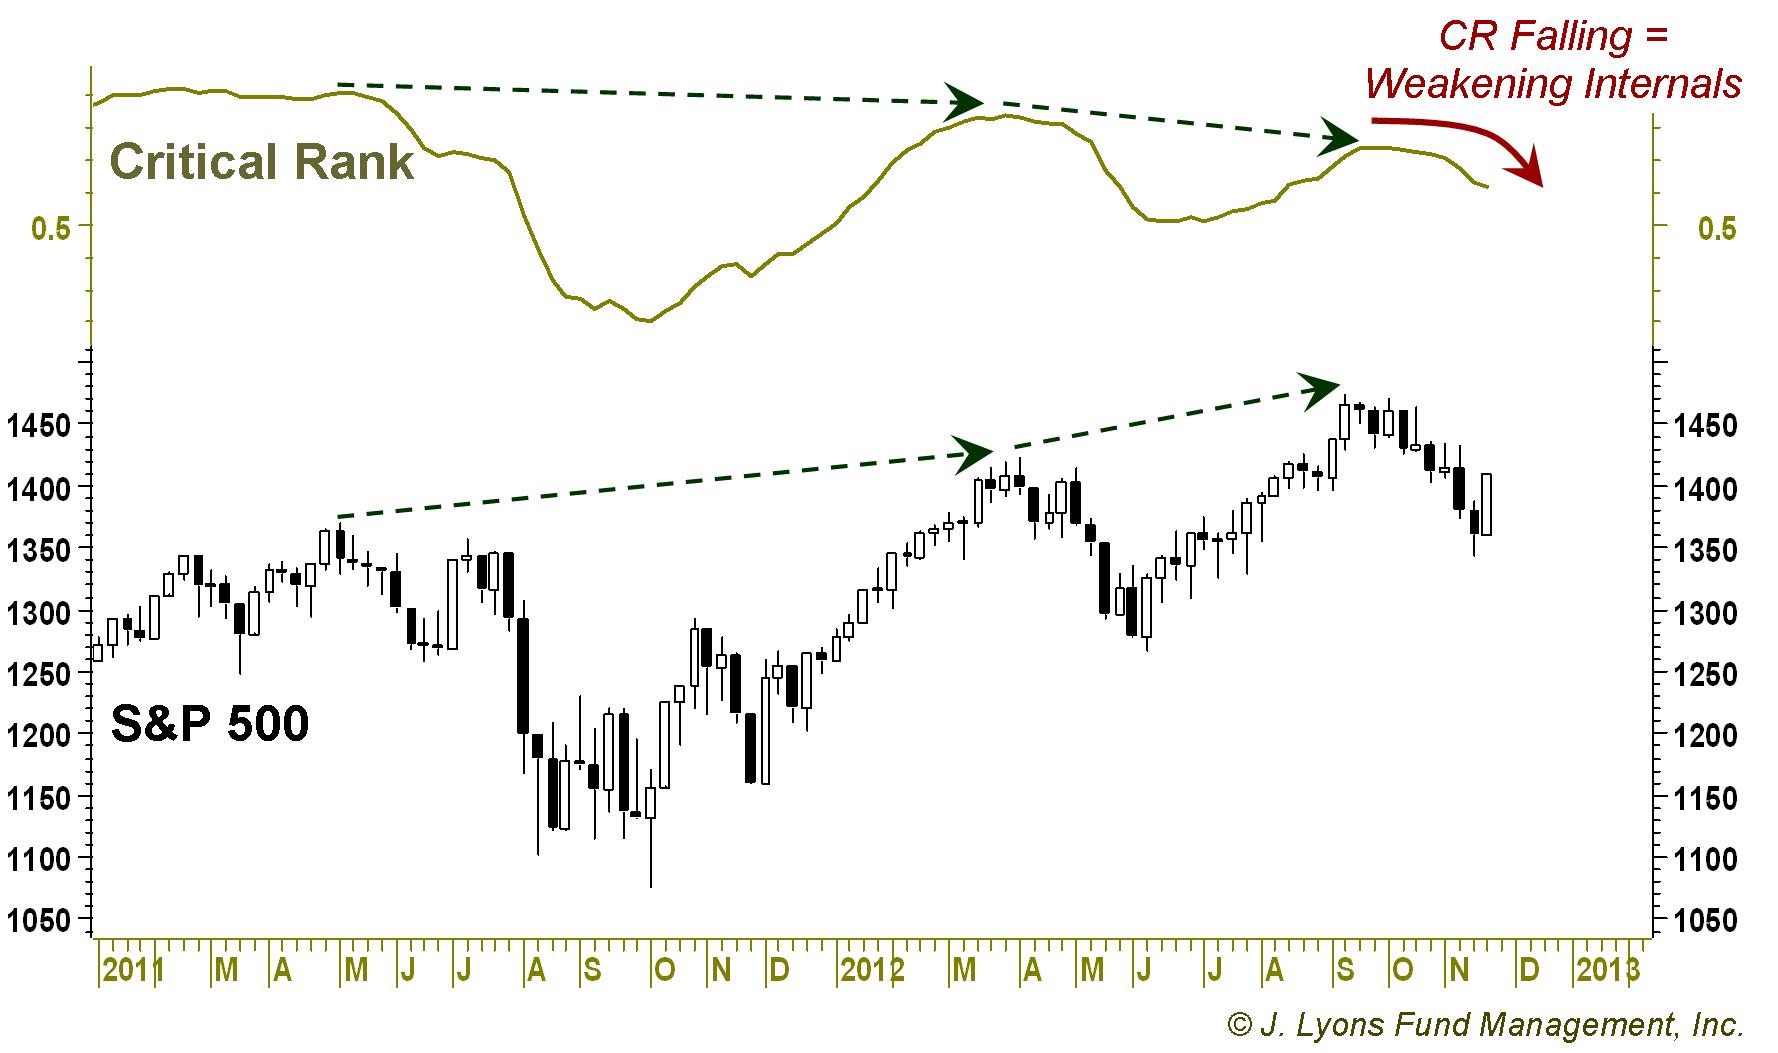
As one can see, the Critical Rank is clearly falling at the
moment, indicating a diminishing amount of support for this market.
Additionally, it is a troubling sign that the past three market peaks
have been accompanied by successively lower levels in the Critical
Rank. This is called a "divergence" and is the sign of a weakening
rally. Ominously, this pattern also occurred at the past two cyclical
tops in 2000 and 2007.
We can thus conclude that at the present time, the most
important potential source of support for the market, its internals,
are not supportive of a strong rally. Furthermore, the weakening of the
internals even as the market has made higher highs over the past few
years indicates a "thinning" of the rally and elevated risk once the
market cracks.
Economy
Without the support of the internals, the market is already on
thin
ice. Since the internals really are the market, the two cannot
go
separate ways for long. We have found other potential areas of support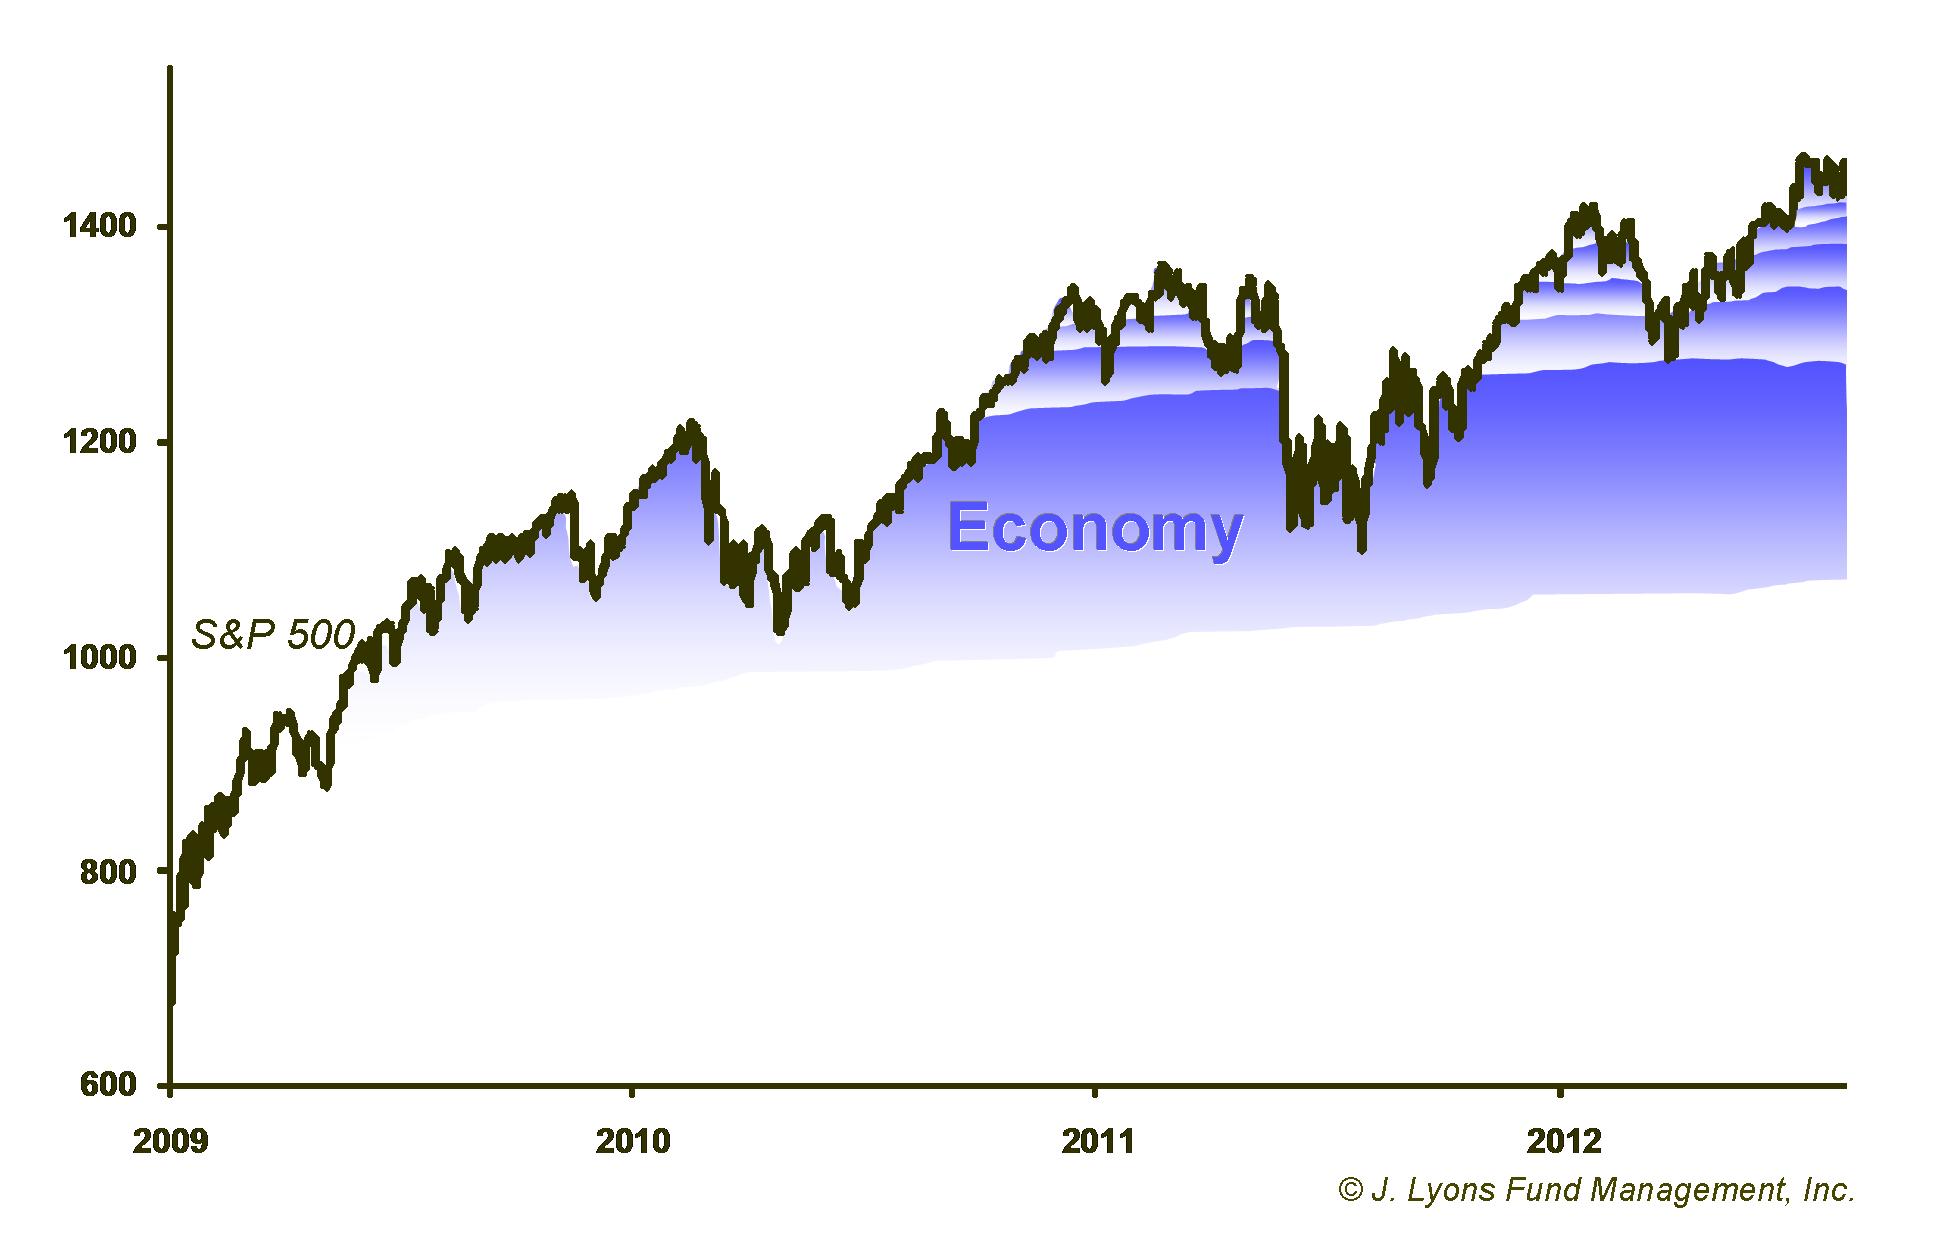 from outside
the market so unreliable that we do not even consider them in our model
when quantifying
risk. To the extent that they do provide support, it is usually
manifested in stronger internals. That said, certain elements can
distort the market temporarily. Since that is really all the market can
hang its hat on at this time, let's look at this potential temporary
support.
from outside
the market so unreliable that we do not even consider them in our model
when quantifying
risk. To the extent that they do provide support, it is usually
manifested in stronger internals. That said, certain elements can
distort the market temporarily. Since that is really all the market can
hang its hat on at this time, let's look at this potential temporary
support.
The most obvious factor outside the market in which to look for support is the economy. Many people ask what sort of weight we place on the economy when making investment decisions. The answer is zero. The relationship between the economy and the market is inconsistent and vague and, most importantly, provides little actionable benefit. It is true however, that in general, a strong economy is obviously better for the market than a weak economy. A cursory look at the economy currently does not inspire much optimism.
One interesting indicator of the economy, and probably more expressive than using GDP, is something called the Chicago Fed National Activity Index (CFNAI). The CFNAI is a compilation of 85 monthly economic indicators that provides a comprehensive look at whether the economy is growing above or below its potential trend. The "Diffusion Index" portion of the CFNAI simply tallies the percentage of the 85 indicators that are registering above-trend growth.
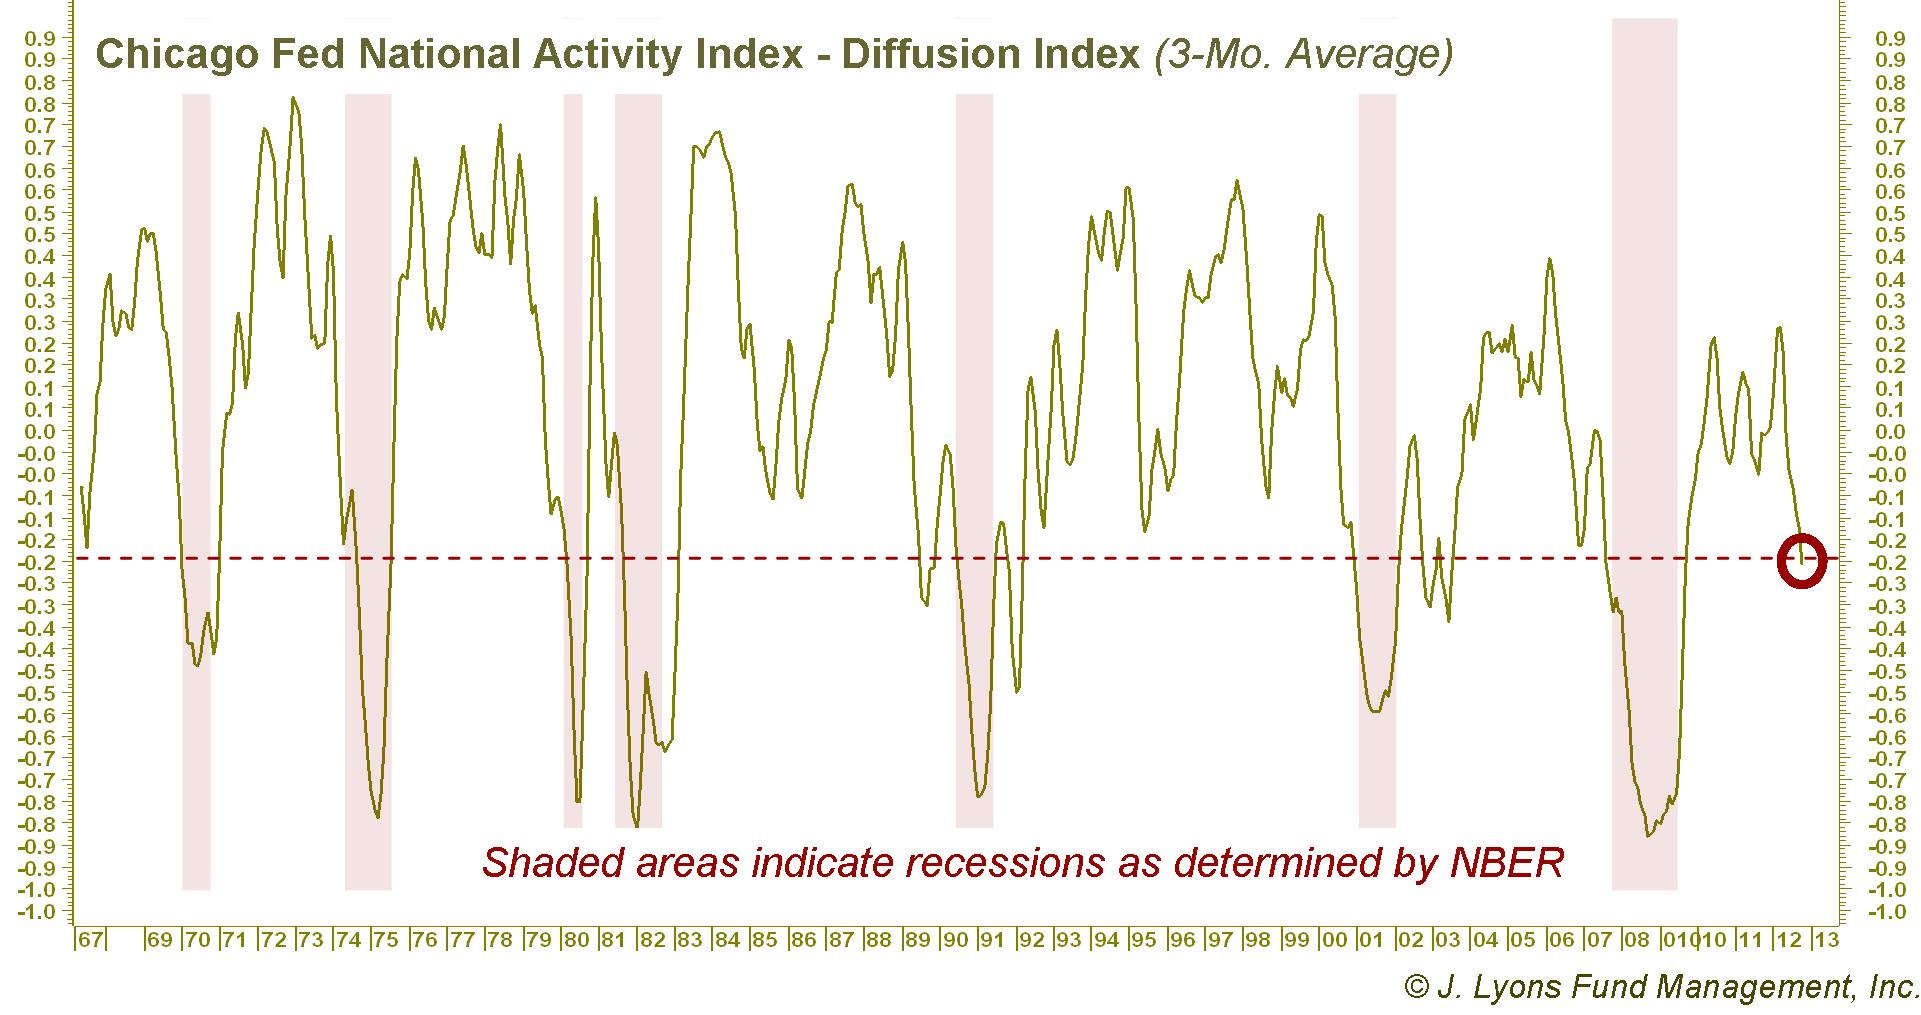
Using the recommended 3-month average to smooth out
volatility, the CFNAI Diffusion Index is currently at a level which, in
its 45-year history, it has only reached when the economy was in a
recession, about to enter a recession or recently emerged from a
recession. It certainly does not indicate a great deal of support for
the stock market, particularly considering the market has been rising
during the past few years while this index has been weakening.
Other Potential Layers of Support
Without positive internals or a strong economy to bolster the
market, support for a stock rally appears to be melting away. What then
could possibly keep this market up? There are a myriad of other factors
that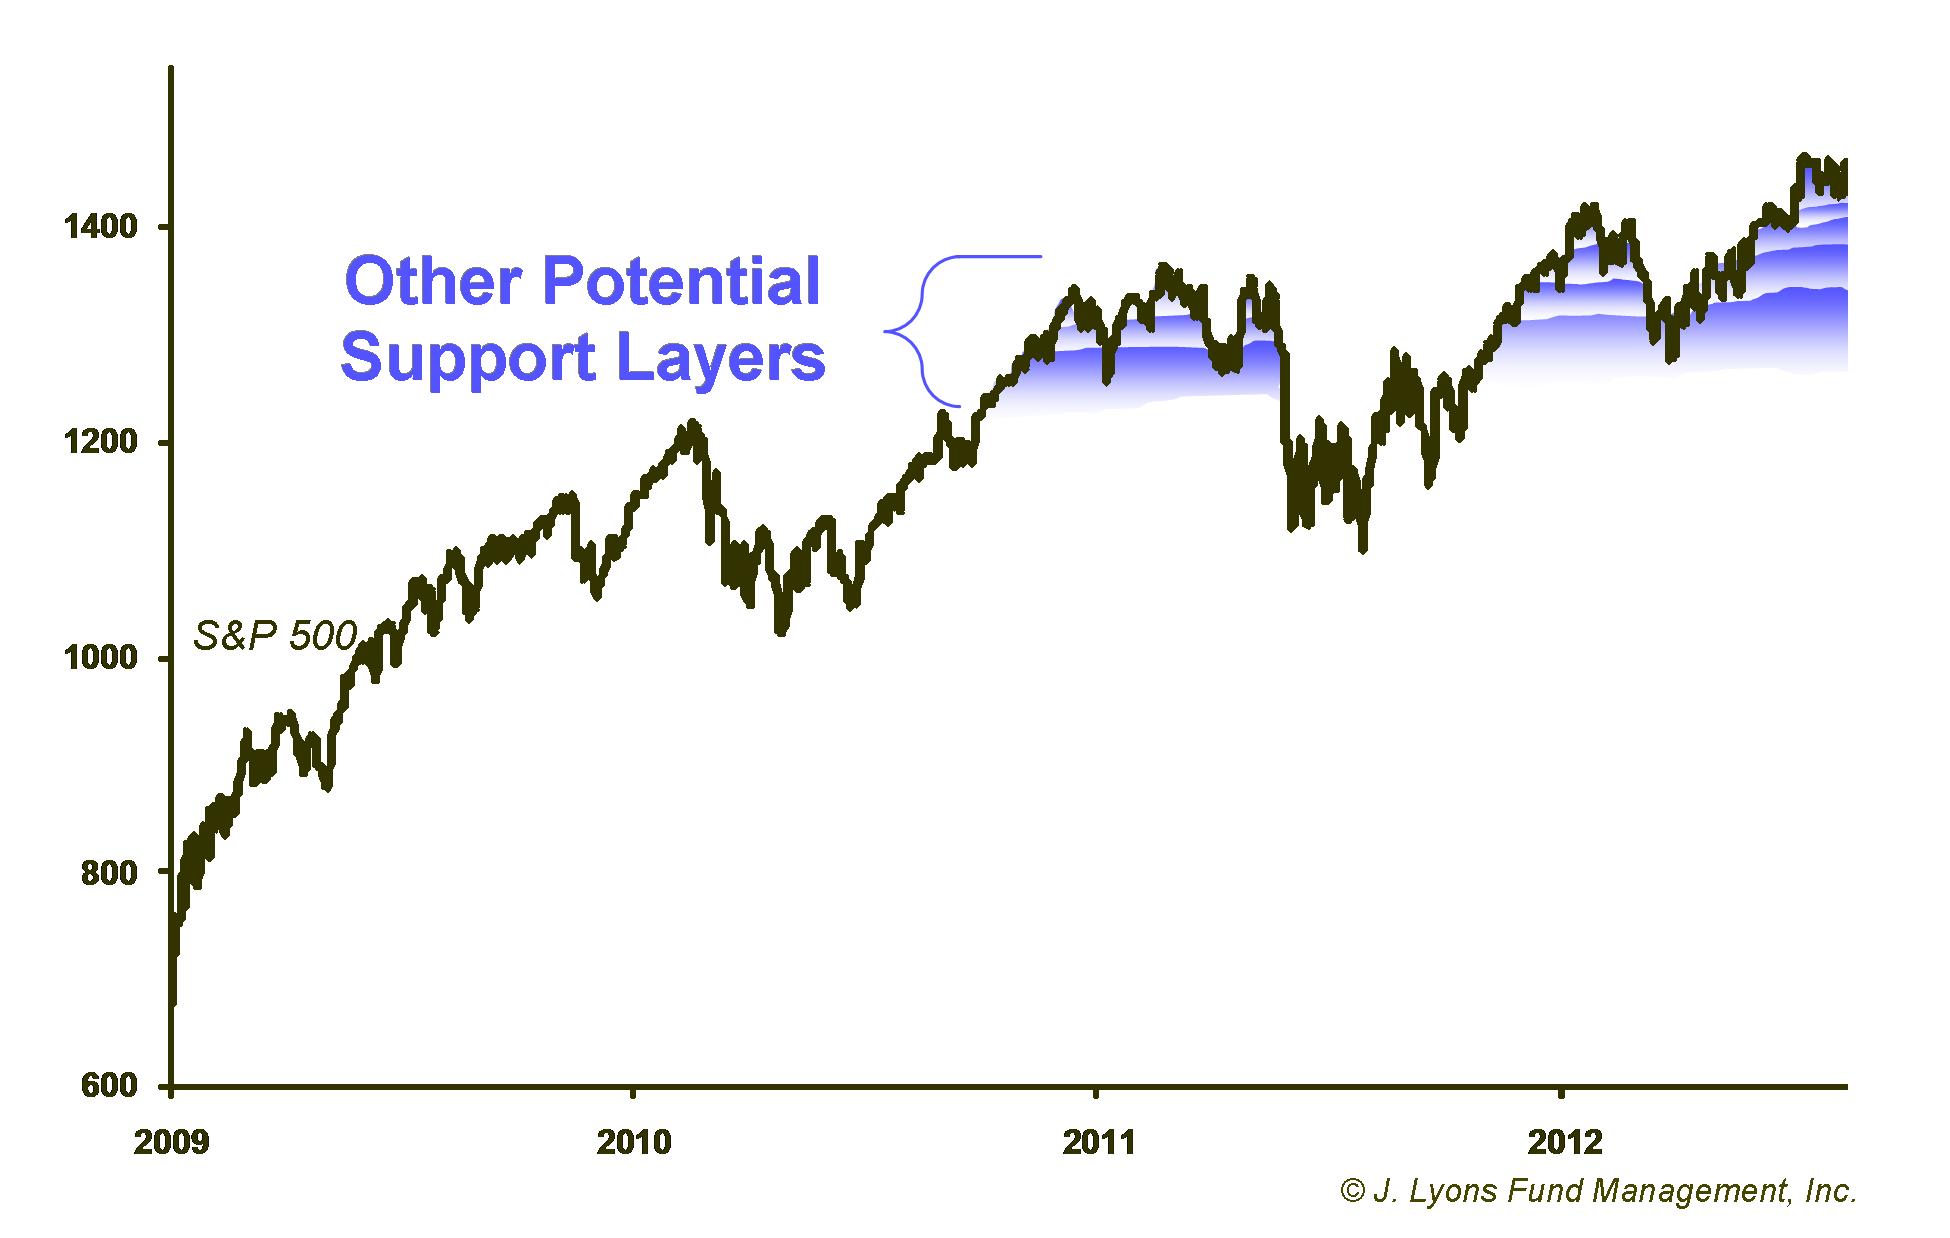 could provide a positive influence. However these factors fall into
categories that run the gamut from the cyclical to the temporary to the
unknown. While it is possible that stocks can continue higher on
such smoke and mirrors, those are not characteristics upon which one
should invest much hard-earned capital.
could provide a positive influence. However these factors fall into
categories that run the gamut from the cyclical to the temporary to the
unknown. While it is possible that stocks can continue higher on
such smoke and mirrors, those are not characteristics upon which one
should invest much hard-earned capital.
Here are some of those potential near-term layers of support.
Corporate Earnings
As with economic analysis, we do not factor earnings data into our Risk Model. First off, it is a tenuous relationship between earnings and their effect on stock prices. Additionally, there is often too much "massaging" of earnings for them to be believable, or at least helpful. However, we will concede that, over the longer-term, more profitable companies generally equate to supportive stock prices.
While corporate earnings are near record highs, all is not totally rosy on this front. Much of corporate America's profits in recent years has come as a result of cost-cutting measures, such as decreased capital expenditures and layoffs. Companies are getting more out of the material and human resources they have. This has resulted in very favorable margins for companies. However, this is cyclical. If economic growth is not sufficient, there comes a point where companies stop getting more for less. That point may have arrived.
Likely due to a slowing economy, about 40% of S&P 500 companies missed their revenue estimates in the 3rd quarter. That is the highest percentage since the financial crisis in 2009. If companies cannot continue to generate a sustained level of revenue, their margins shrink. To maintain their margins means companies will need to get even leaner, meaning more cut-backs and layoffs. This is not the stuff of a booming economy nor is it supportive of a rising stock market.
Election/Presidential Cycle
This is one layer that, to the extent it did provide support, we know precisely when will melt away. This refers to the tendency of the market to perform in a consistent pattern surrounding both the presidential election as well as throughout the 4-year presidential term.
Subjectively, the expectation is that leading up to an election, the incumbent president will espouse policy or other rhetoric that will be supportive of the economy and markets, or at least placate the public in general. While difficult to prove, it is basic survival instinct for a president to behave this way. It would certainly be naive to dismiss the possibility of this effect. There is no shortage of evidence of market-supportive events leading up to the recent election, from the Fed's introduction of a new round of quantitative easing in September (with the market at a 52-week high) to a series of literally off-the-charts positive economic releases shortly before the election.
Statistically, there is ample historical evidence for the existence of this phenomenon. Looking at the average behavior of the market over the course of a 4-year presidential term, consistent patterns do emerge. One tendency is for the market to behave very well just prior to an election. In fact, the very best-performing quarter over the four years is the 3rd quarter of an election year with an average return of over 5%. This is not surprising if one is to believe the presidential survival theory. Unfortunately, the benefits of the cycle end there as the first three quarters of the presidential year 1 represent one of the worst 3-quarter stretches of the cycle. Therefore, not only is this layer of support gone, but it will actually begin to weigh the market down.
Year-End Markups/Bonus Season
Another layer of influence falling under the "seasonal" category is the year-end rally phenomenon, or at least the year-end selloff-prevention phenomenon. This reflects the tendency of the market to hold up relatively well at the very end of the year. Cynics will claim that it is a result of fund managers' attempts to buoy their performance numbers or efforts by those on Wall Street to pad their year-end bonuses. While there is a lot of subjectivity and little proof behind the claims, the cynics are almost certainly correct. Yes, such year-end markups are technically illegal. However, to dismiss the human natural urge to bonus-hunt, like the presidential survival instinct, would be naive. So while Wall Street bonuses have been cut back under scrutiny from regulators and public pressure, this should still be a source of attempted support, particularly with the vast majority of managers under-performing the market this year. After year-end however, the layer instantly dissolves.
Sentiment
Sentiment refers to the amount of "bullishness" versus "bearishness" present in the marketplace, either through surveys or through measures of actual investment positioning. It is not necessarily a catalyst in causing the market to move. However, when sentiment reaches an imbalance extreme (an over-abundance of either bulls or bears), it indicates a condition wherein, once the market does turn, it has the potential to move a significant amount until the imbalance is removed. For example, after a market decline, if there is an extreme in the number of investors who are bearish, when the market turns around those bears will provide fuel to the rally by having to buy back in until the imbalance is rectified.
Although far from a consensus, several sentiment indicators are currently indicating an elevated level of bearishness. This can provide some additional support to the market should a year-end rally emerge. However, this is not a catalyst nor does it have a long-term effect. Once the bearish imbalance is removed, the layer of support is removed. It does not necessarily need to go to a bullish extreme for the market to weaken, particularly if the internals are not in a supportive position.
There is one other caveat to the sentiment picture currently that most analysts fail to recognize. That is the effect that the 12-year secular bear market has on the sentiment dynamics. After a prolonged period of stagnation, sentiment can change structurally. Specifically, it may not go the "normal" bullish extremes and it may go further into bearish territory before reaching an extreme. Many of the sentiment measures in use now did not exist during the last secular bear market. Therefore, their parameters may need to be adjusted to reflect the current environment, or at least reconsidered.
The Fed's Printing Press
This is the potential support layer falling in the unknown category. The Federal Reserve can provide literally unlimited liquidity in the market. Its quantitative easing (QE) operations over the past few years were unprecedented and, therefore, the full effects of these actions are not known. In the short-term, all that money has to go somewhere. It certainly appears that such actions provided support for rising equity prices over the past few years...and bond prices...and commodity prices. Do we know that prices would not have risen without the Fed's actions? It can be argued that stocks would have risen anyway to correct the cyclical imbalances that existed at the lows in 2009. What if we are where we would have been anyway without the Fed's action...only with 50% more debt?
In light of such unprecedented actions, those questions can go on and on. We will deal with what we do know. First off, we do have an example of massive liquidity injections into a market that we can use as, at least, a loose guide. Japan has been undergoing quantitative easing for the last roughly 15 years (we think they're on about QE10 now.) How has that worked out for them? Their stock market is down 75% from its all-time highs and near its lows of the past 30 years. While it is true that the market is not the economy, the explicit goal of quantitative easing is to raise asset prices. Let's just call their attempt a failure then. Disturbingly, the QE actions in the U.S. seem to be losing their desired effect as well. Each successive QE operation has resulted in less of a rise in stock prices at least. The latest, QE3, brought a boost in stocks for all of a day and a half.
Lastly, and most importantly, even with the Fed's actions, our investment models have functioned normally. That is the benefit of using only data from the market itself as input to guide investment decisions. The market is the greatest and most objective filter and reading its signals will inform one of the market's intentions. Therefore, we will continue under the assumption that, whatever events come about, the market will filter that information and thus our objective models will continue to operate normally. So while the Fed's printing press may be a (temporary and distortive) layer of support for the market, we will not rely on it while conducting our investment process.
Conclusion
We are currently presented with a stock market that has
rallied with
impressive persistency, both on a cyclical basis (since 2009) and on a
shorter-term basis this year. There is an old adage that says that the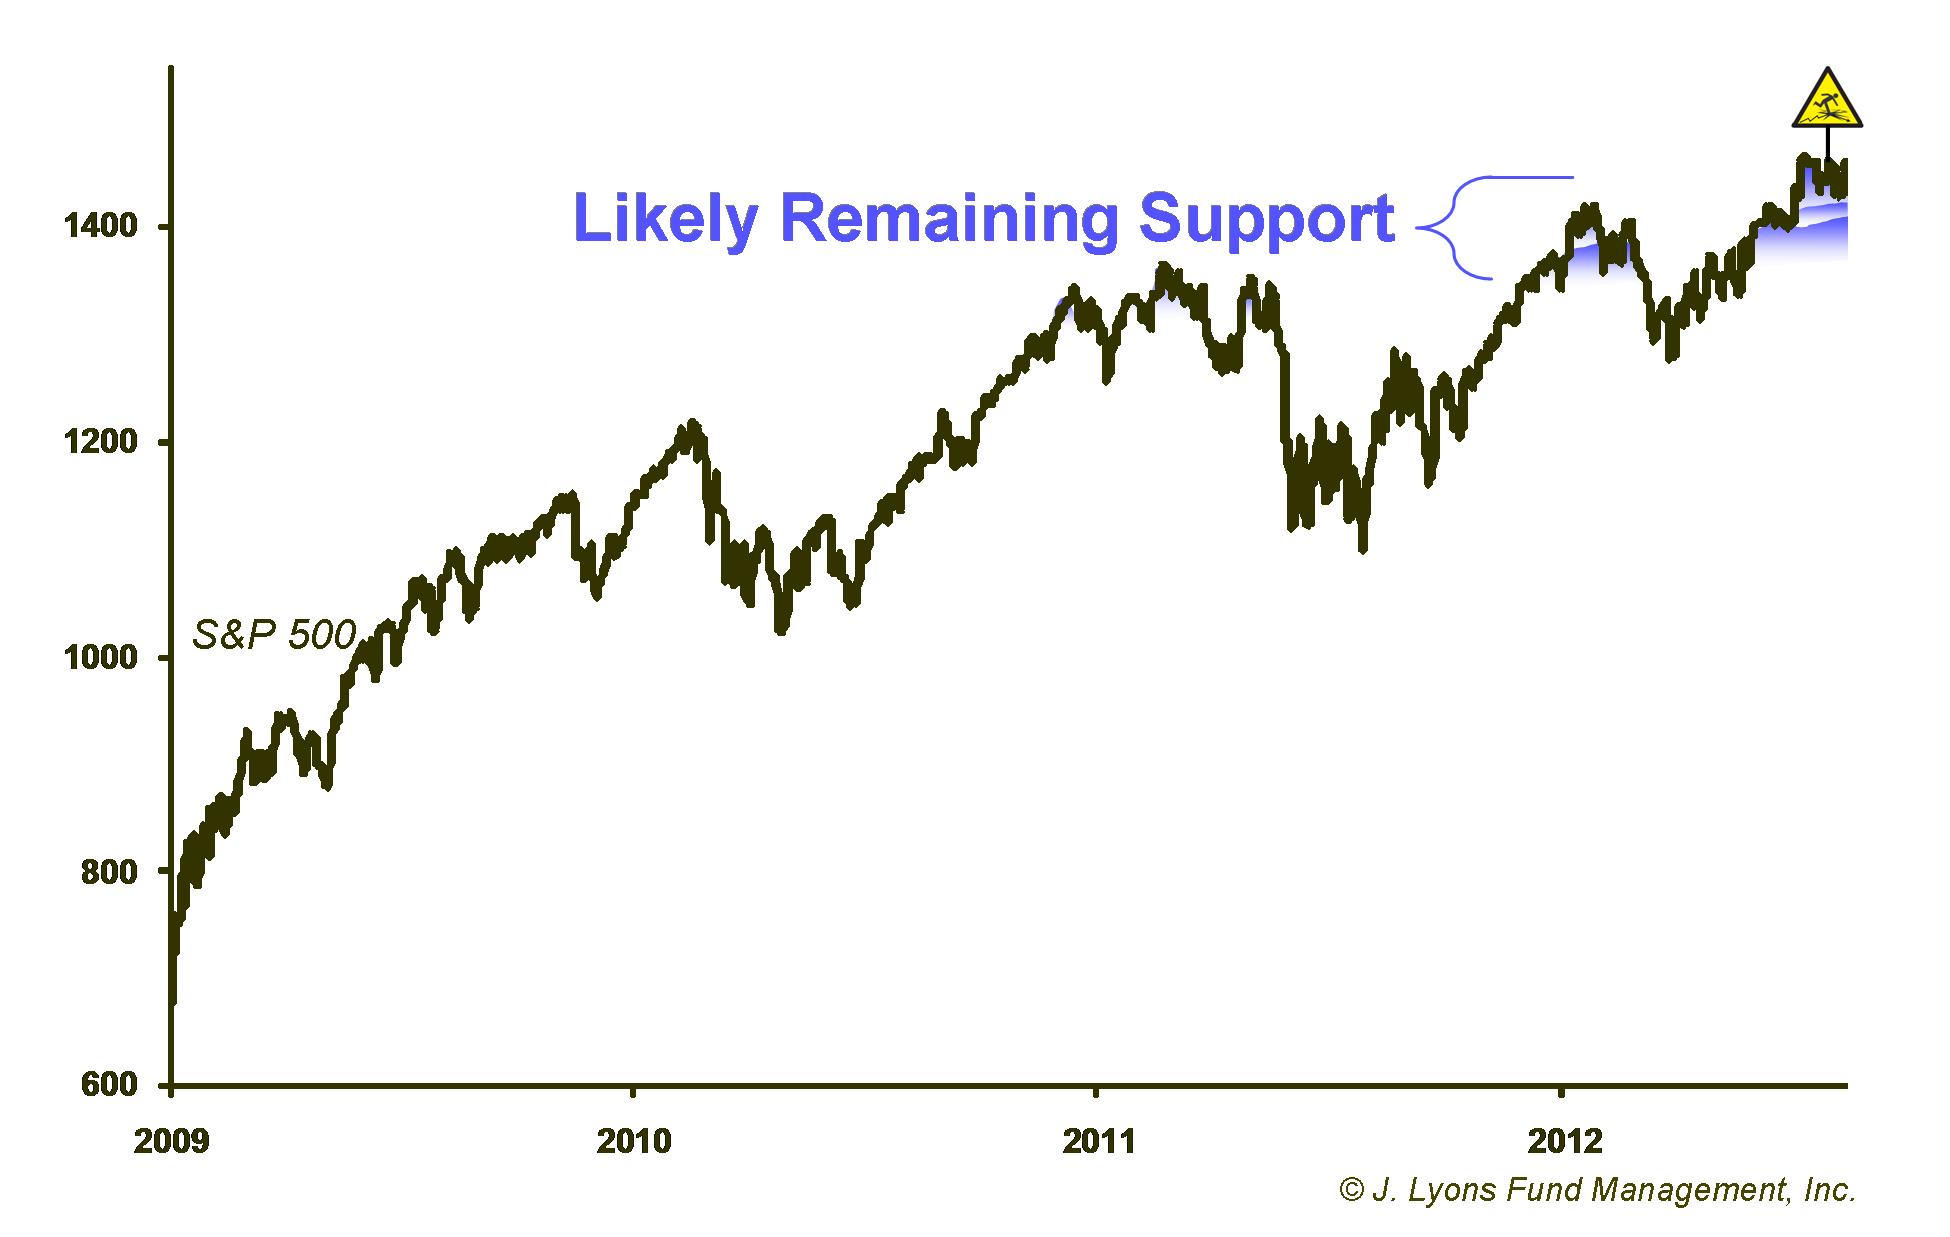 most bullish thing a market can do is go up. So why not just leave it
at that and go ice fishing? Well, just as you cannot judge the
thickness of a frozen pond by looking at the surface, not all rallies
are built upon the same support. And though the market rally has not
yet collapsed, its underlying support is becoming thinner and thinner.
most bullish thing a market can do is go up. So why not just leave it
at that and go ice fishing? Well, just as you cannot judge the
thickness of a frozen pond by looking at the surface, not all rallies
are built upon the same support. And though the market rally has not
yet collapsed, its underlying support is becoming thinner and thinner.
The most important underpinning of a market rally is strength in the market's internals. An abundance of strongly-performing individual stocks provides fuel to a rally and, importantly, limits the risk of a significant sell-off. This component is currently lacking, leaving the market with little support once it cracks. Likewise, secondary potential support from a strong economy unfortunately is not present today. The market is thus left resting upon a mixed bag of support stemming from seasonal and sentiment factors to Fed-induced hope. That is very thin ice.
The market's best hope would be for the internals to turn higher again. Even then, however, as recent newsletters have touched on, there is strong evidence to suggest that further upside would be limited anyway. Absent stronger internals, the higher the market goes without substantial layers of support, the further away the ground below the surface gets...i.e., the greater the risk of big losses. One other element that scares us is the dominance of high frequency, computer-driven trading. This element accounts for a great deal of the volume, buying and selling, and the bids placed in the market. As witnessed during the Flash Crash in 2010, when the market turns, the machines can sell at a furious pace and those supposed bids can disappear very quickly. Therefore, the "ground" may actually be a lot further down than it is thought.
For investors who believe they can get out in time to prevent significant losses when the rally ends, we would remind them of 2008. As Mr. Einstein stated, the last thing to collapse is the surface and at that point, it may be too late.
Dana Lyons
The
commentary
included in this newsletter is provided for informational purposes
only. It does not constitute a recommendation to invest in any
specific investment product or service. Proper due diligence should be
performed before
investing in any investment vehicle. There is a risk of loss involved
in
all investments.
| Tweet |
|