| September/October 2013 | Posted October 2, 2013 |
Under the Big Top
Certain conditions have consistently characterized cyclical tops within secular bear markets. These conditions are presently in place.
"Without promotion, something
terrible happens...Nothing!"
- PT Barnum
We have, at times, been accused of promoting a permanently bearish market view. That is not accurate (the well-known pundits who have been bearish since 2009 -- or even 1987 -- deserve that perma-bear mantle.) No, our intention is actually quite the opposite. As our newsletter mission states, our aim is to educate investors that the market actually goes up and down, on a regular basis. Therefore one should resist the temptation to be perma-anything. The reason we seem to be disproportionately focused on the downside (or the risk side of the risk/reward equation) is simply because the airwaves are already saturated with the alternate message, i.e., "stocks for the long run", "buy-and-hold", "buy, buy, BUY!!" And those filling the airwaves with this message are the undisputed kings of promotion: Wall Street. You might consider them the circus callers of the investment industry. Given their dismal track record of managing risk, without such mass promotion, their assets under management would likely be, well, nothing.
Admittedly, we have been overly wary of the market over the past 12 months or so as the post-2009 advance has attained historically unprecedented heights for a rally of its kind. Perhaps we underestimated the effects of the Bernanke Bros. Banker and Bailout Circus. And perhaps we underestimated the extent to which retail investors continued to shun the stock market. After all, the market -- especially a secular bear market -- tends to operate in a manner which exerts the maximum amount of pain on the maximum number of people. Another quote famously attributed to PT Barnum is that "there's a sucker born every minute." Well, they aren't suckers, but it could be said that investors are consistently suckered into stocks right near market tops. Thus, prior to this year, perhaps there simply weren't enough investors "in the tent" to justify a top. As we reported in our June Newsletter, however, investors have returned in droves this year.
One fact we are most confident in is that the market remains mired in a secular (long-term) bear market and sustainable new highs likely will not be achieved for some time. Therefore, with the market currently near a new high, a cyclical bear market is forthcoming at some point. However, rather than warn anecdotally of such a threat, we have attempted to identify those conditions that have historically and consistently been present at cyclical tops during secular bear markets.
Is there some measure of data-mining (perusing the data to find the desired results) involved here? To a degree, yes. However, we have no agenda other than to assist investors in identifying high-risk, "toppy" markets in the future based on historical precedents. Besides, that is what virtually all market analysis boils down to: identifying historical patterns to determine "normal" behavior. And while market conditions are never identical, similar parts of market cycles exhibit similar traits. As Mark Twain said, "history doesn't repeat itself, but it does rhyme." And since we do not have a crystal ball (we are not economists, after all), that is the best we can do. And data-mining or not, the following are facts based on our research:
During the past 2 secular bear markets,
- This collection of conditions has been present at every cyclical top but one
- This collection of conditions has never been present at any other time
- These conditions are present now
Disclaimer: While this study is a useful exercise, JLFMI's actual investment decisions are based on our proprietary models. Therefore, the conclusions based on the study in this newsletter may or may not be consistent with JLFMI's actual investment posture at any given time. Additionally, the commentary here should not be taken as a recommendation to invest in any specific securities or according to any specific methodologies.
Cyclical Market Top Conditions within Secular Bear Markets
As with cat-skinning, there are countless ways to attempt to identify market tops. None of them are holy grails. Our desire here was to identify various conditions among data that we look at that were A) consistently present at cyclical market tops during the past two secular bear markets and B) consistently not present at other times. In an attempt to derive more meaningful and robust value from the analysis, we selected conditions from a variety of data categories, specifically:
- Price
- Sentiment
- Valuation
In analyzing the data, we used the same periodicity (monthly) and methodology (standard deviation) for identifying "toppy" levels in each of the data series. This was in an attempt to minimize the data-mining effect and to bring consistency and simplicity to the process. As Albert Einstein said, "make everything as simple as possible, but not simpler."
Price
The most straightforward way to identify cyclical market tops is to look at the price of the market itself. Of course, this can only be determined after the fact. However, there can be clues if one knows what to look for. During secular bear markets, stocks tend to move sideways in a wide range. This can make it easier to identify potential tops since the market often stalls at the top of the range. The market did precisely that several times during the 1966-1982 secular bear market and also topped out during the current secular bear at a similar level in 2000 and 2007.
Of course, the market does not always form a cyclical top right at the upper end of the secular range. To help identify a market that is "overbought", and thus susceptible to forming a top, regardless of where it is in relation to the range, we need to apply a little math. In this case, we have applied a simple standard deviation measure. Since we are attempting to identify major, cyclical tops, we used monthly prices and a standard deviation measure based on rolling 10-year periods to determine the overbought criteria. The shaded red areas in the charts below indicate points at which the S&P 500 was over 1 standard deviation overbought during the past two secular bear markets (i.e., 1966-1982 and the current one since 2000.)
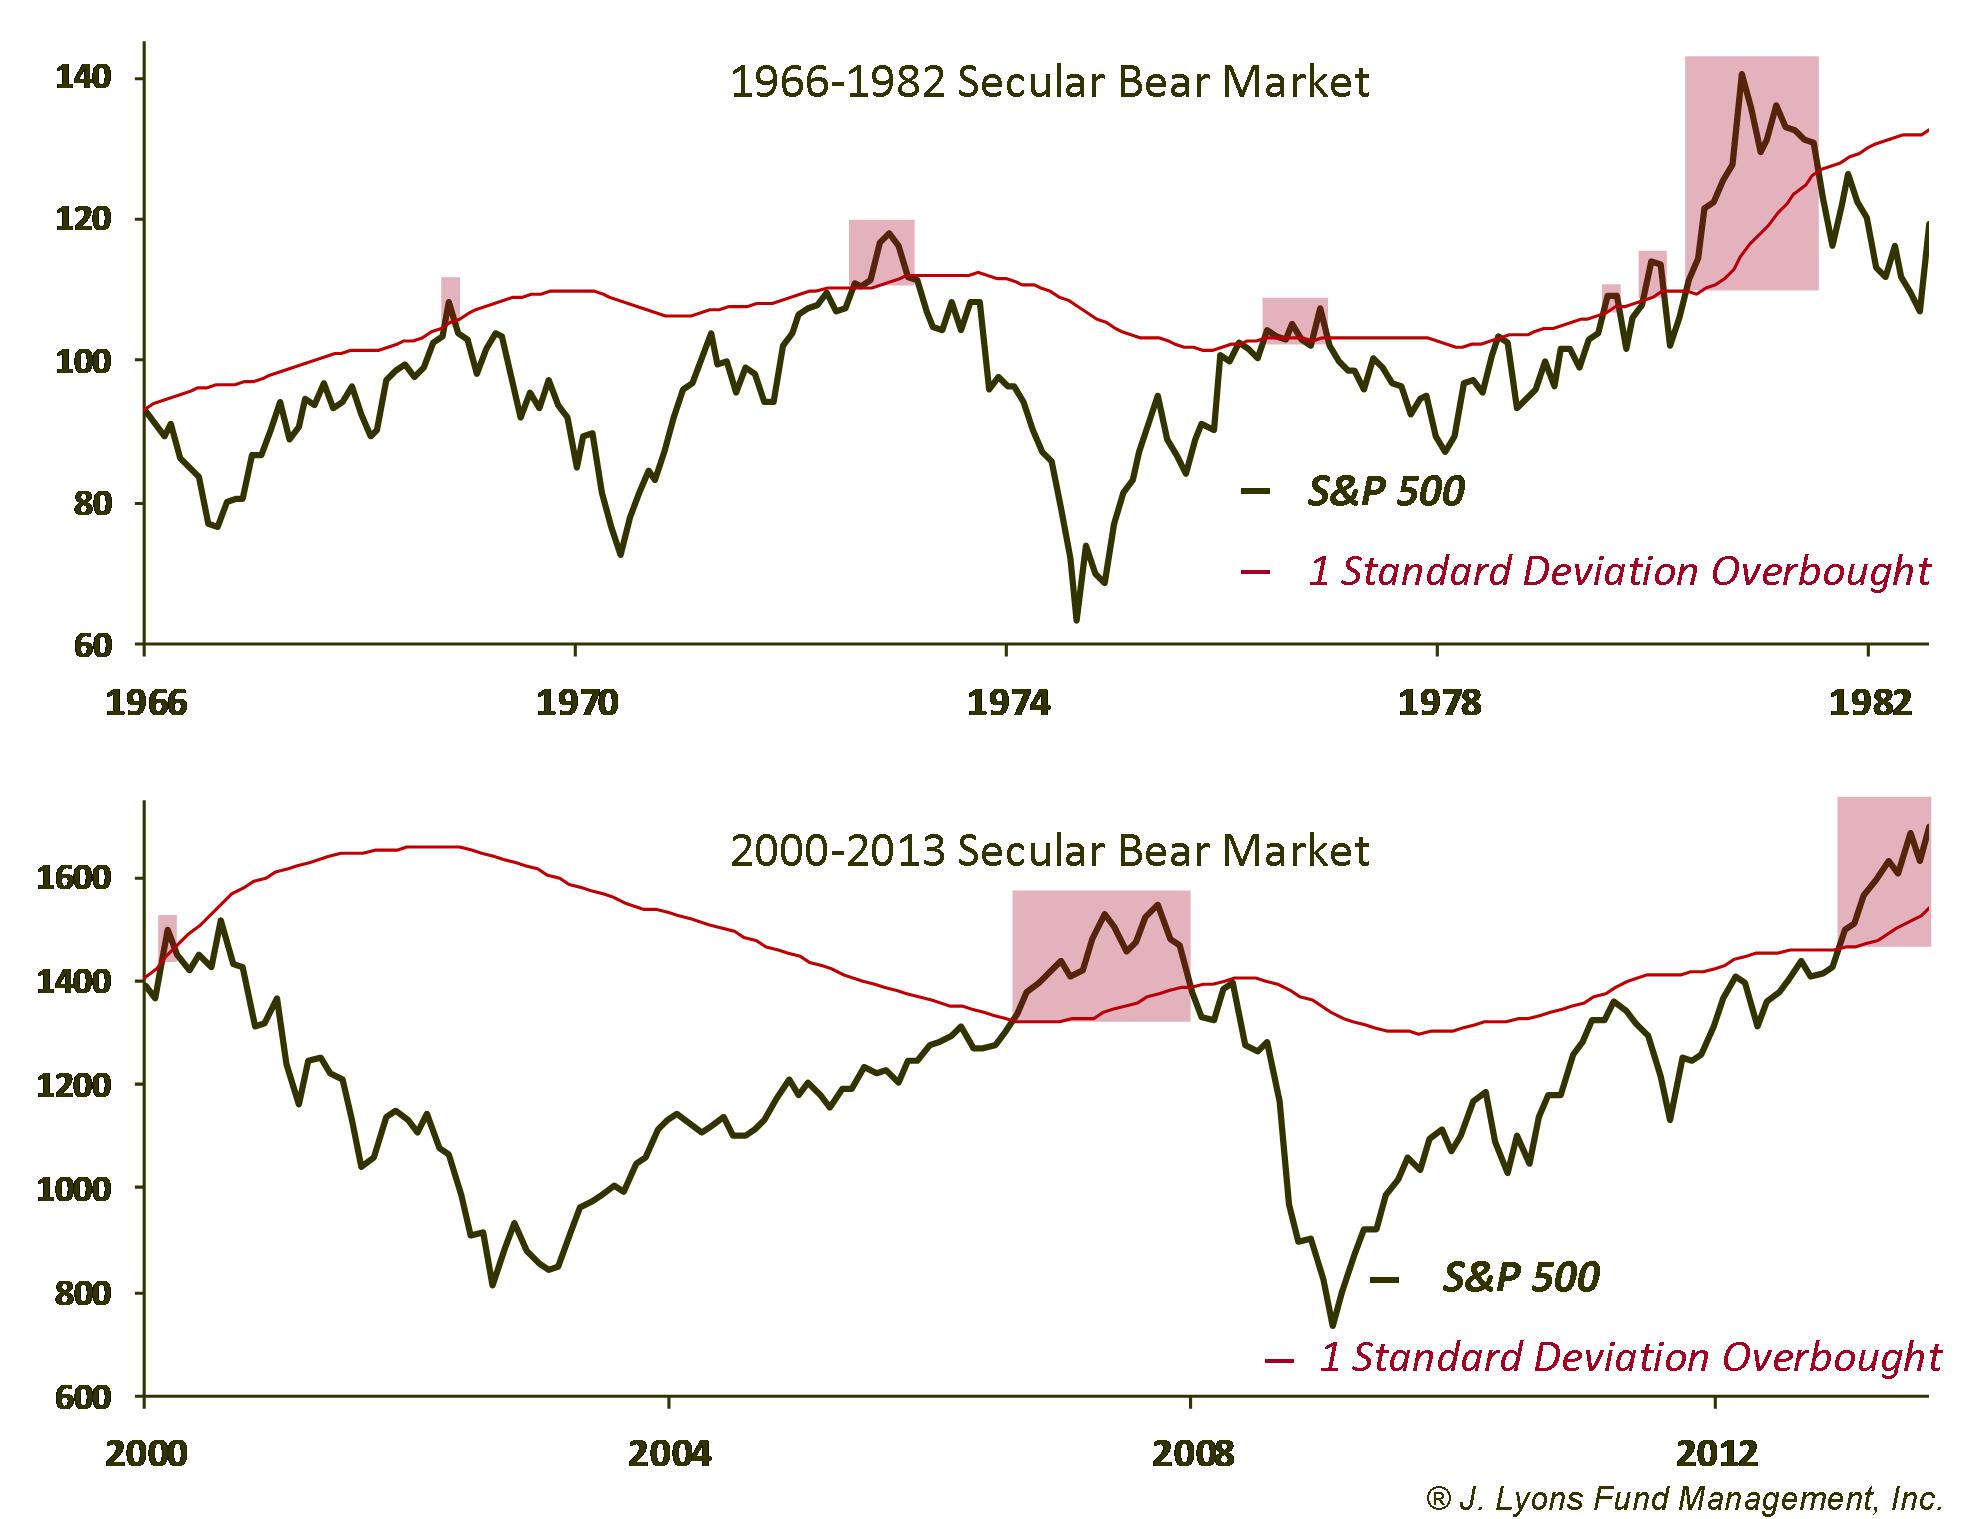
As is evident in the chart, this overbought condition was
present at every major cyclical top during the past two secular bear
markets. It also flashed overbought signals prematurely a few times
during the late 1970's and early 1980's. In addition, in a few
instances (e.g., 1980 and 2006) the overbought condition persisted for
several months before the market topped out. But all in all, while not
perfect, this indicator has demonstrated a pretty impressive track
record. And based on this indicator, price is currently severely
overbought.
Sentiment
The term "sentiment" in investment parlance refers to the degree to which a particular set of investors is bullish or bearish. Typically, bullishness rises during stock market rallies and falls during market declines. Once it reaches a certain extreme, it is considered to be useful as a contrarian indicator, i.e., too much bullishness has negative implications for the market and overwhelming bearishness has positive implications. There are two different types of sentiment measures. One type involves surveys to determine the level of bulls and bears. The other method involves tracking actual investment behavior to measure sentiment. Since actions speak louder than words, this is our preferred method.
The sentiment indicator we are using here measures the percentage of financial assets that U.S. households have invested in stocks. While it is a measure of investment allocation, in essence it is a gauge of investor sentiment. When the market rises for an extended period, people become more bullish and the % of household assets going into the stock market also rises. At a point, the level of assets in the market becomes extreme, or overbought, and indicative of too much bullishness. Like the price chart above, we used the 1 standard deviation point based on rolling 10-year periods to determine the "overbought" level.
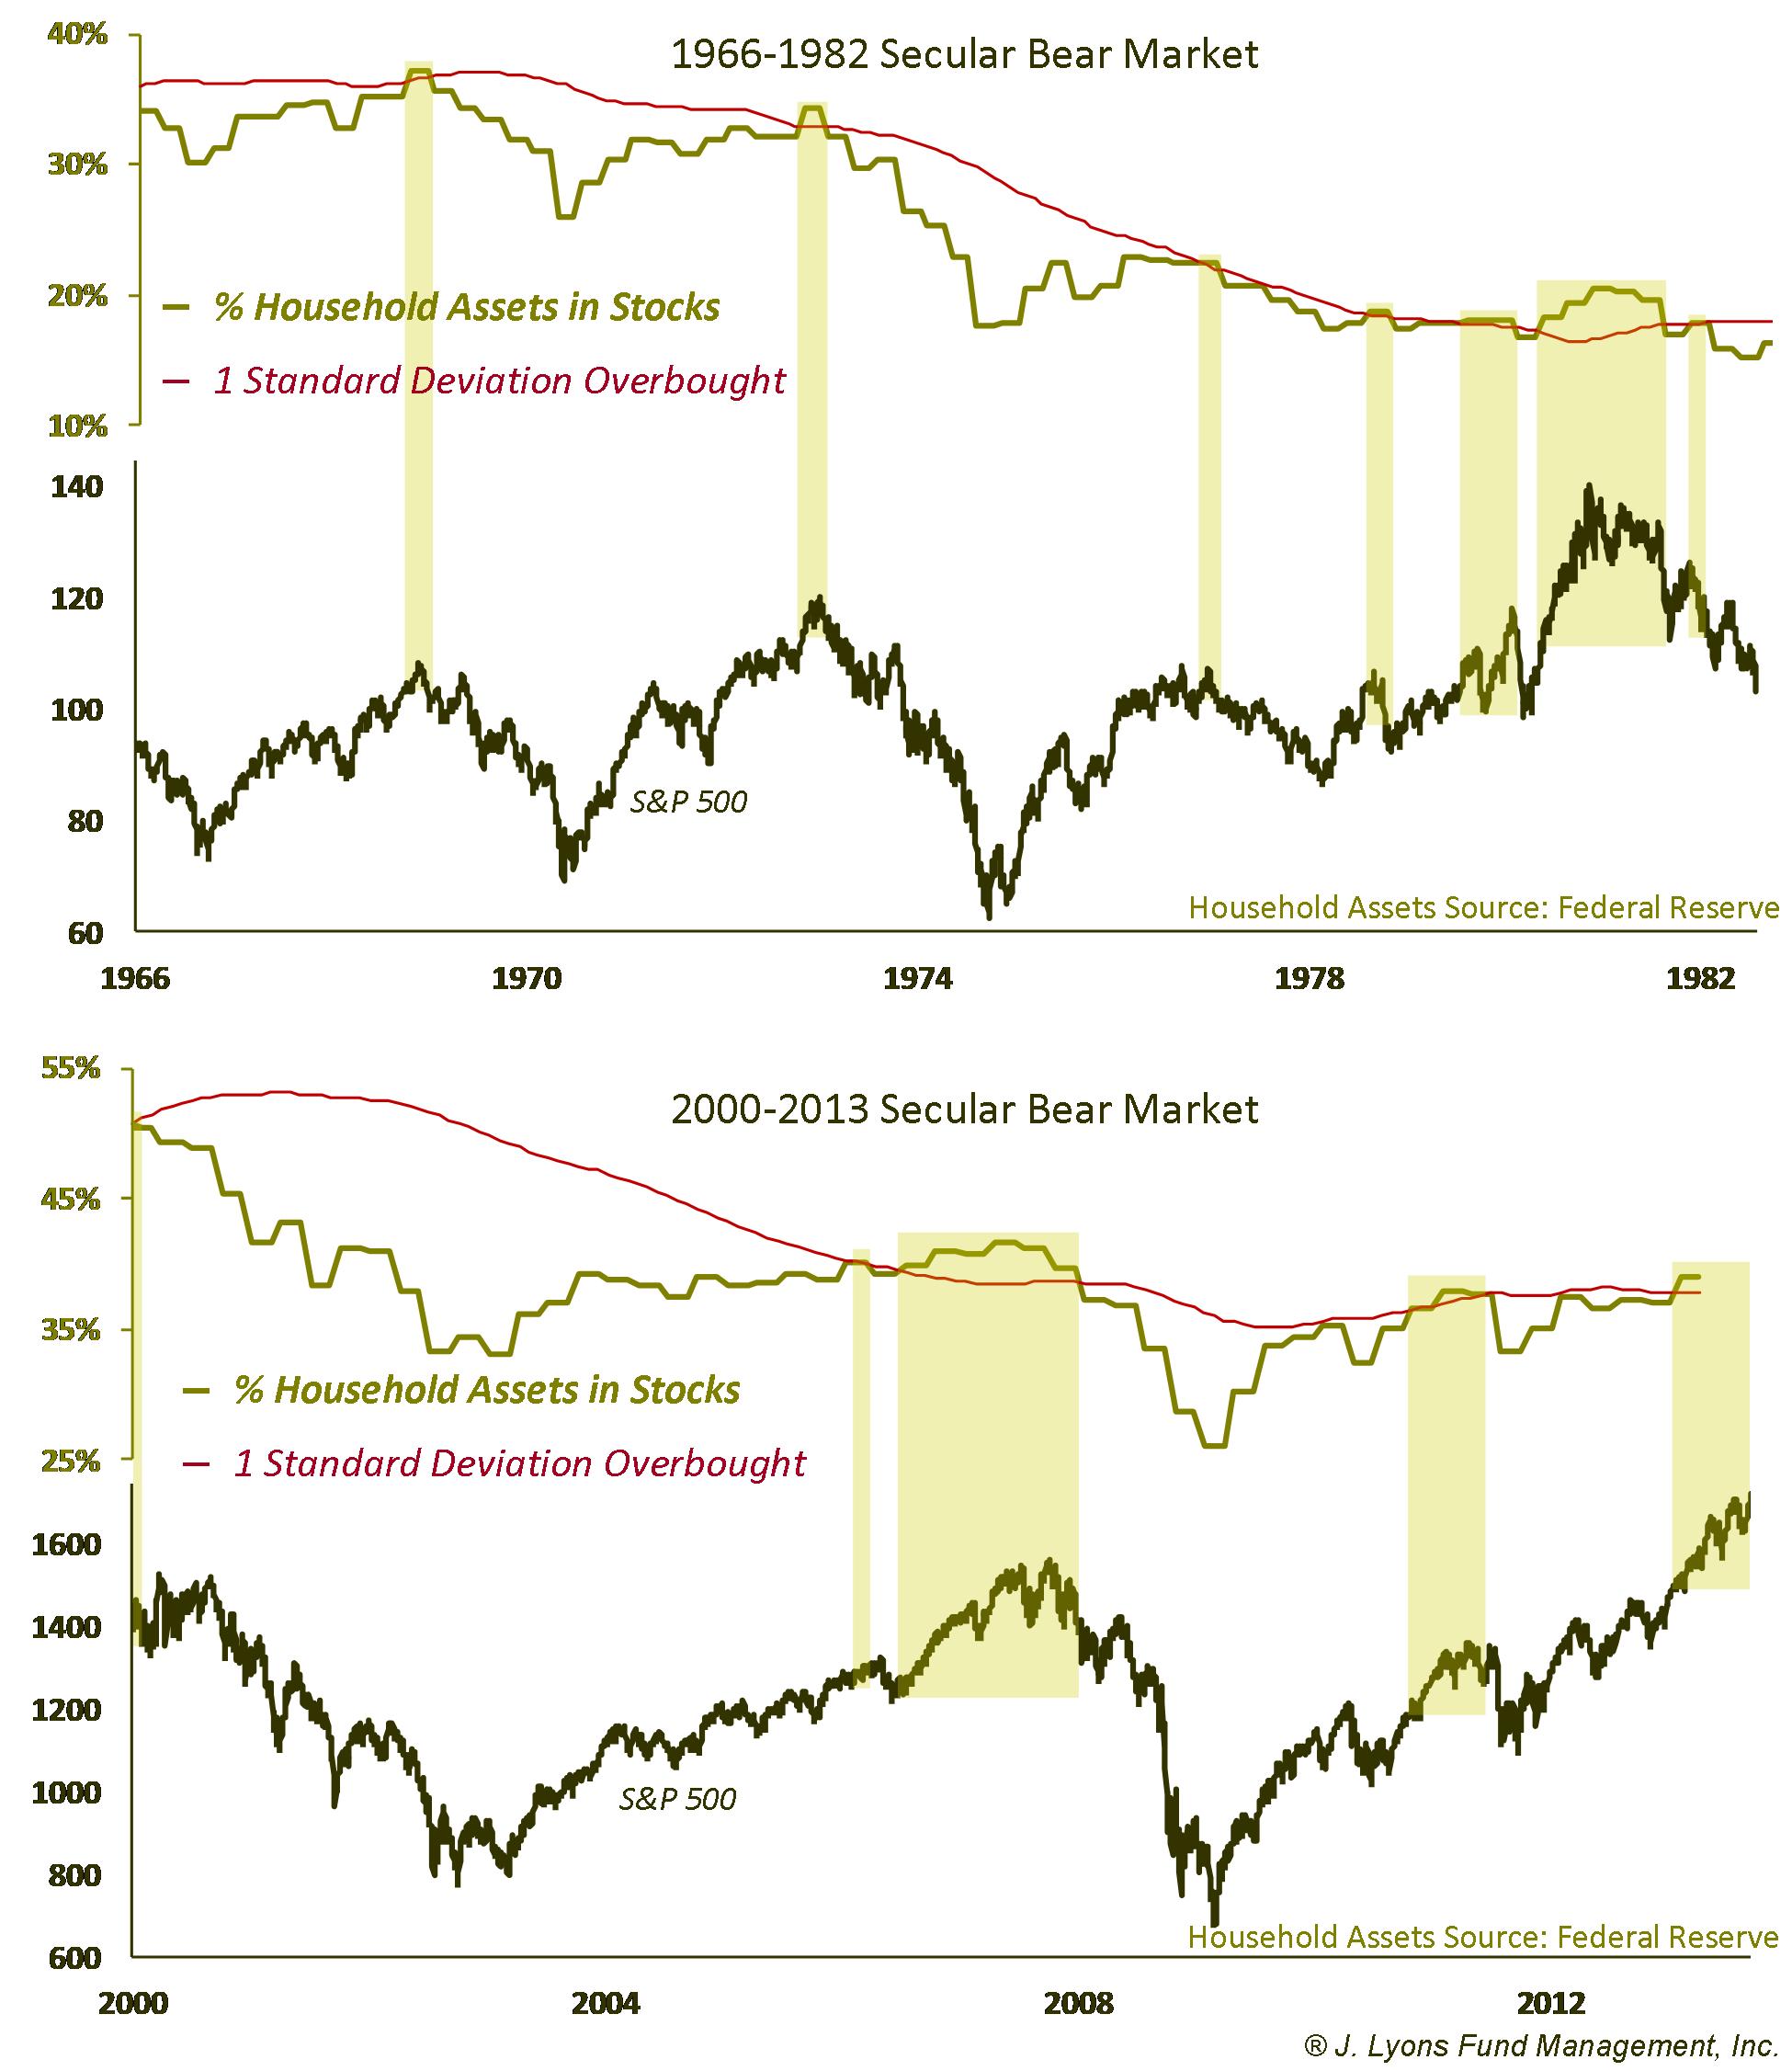
As with price, this overbought sentiment condition also existed at each cyclical top within the past two secular bear markets. Although, it was also a bit early at times and it did occur a few times that did not coincide with cyclical tops (such as 2011, which was a significant intermediate-term top, but not a cyclical one.) So this sentiment indicator too has been a solid, if imperfect warning signal of cyclical market tops during secular bears. It is also flashing overbought at the present time.
We will also note the importance of using dynamic indicators that adjust to the evolving "normal" range of the data in order to determine the appropriate overbought/oversold levels. For example, during secular bear markets, investor deleveraging occurs on a wide scale basis, resulting in the downward trajectory of many measures of investor activity. Therefore, as we emphasized in our June Newsletter, it is crucial to adjust the analytical parameters one is using to the environment rather than maintaining static levels. The % of household financial assets invested in stocks, for example, never approached the lofty levels that existed at the beginning of each secular bear market. Waiting for those levels to be reached would have caused one to miss each successive market top.
Valuation
Lastly, we looked at the behavior of stock market valuation at cyclical tops. Valuation refers to how expensive a stock (or market) is relative to its earnings (or collection of earnings). Like sentiment, valuation tends to rise coincident with a market rally. Indeed, rising valuation is supportive of a rising market, to a point. Like sentiment, there comes a time when prices move too far relative to earnings and valuation thus becomes too pricey, or overbought. At these points, the market is susceptible to topping.
The valuation metric we are using is the Cyclically Adjusted Price/Earnings (C.A.P.E.) Ratio developed by Robert Shiller. C.A.P.E. averages earnings for the past 10 years instead of simply using current earnings in order to smooth out any distortion in the data. As with price and sentiment, we are using a 1 standard deviation measure on 10-year rolling monthly valuation readings to delineate the "overbought" condition.
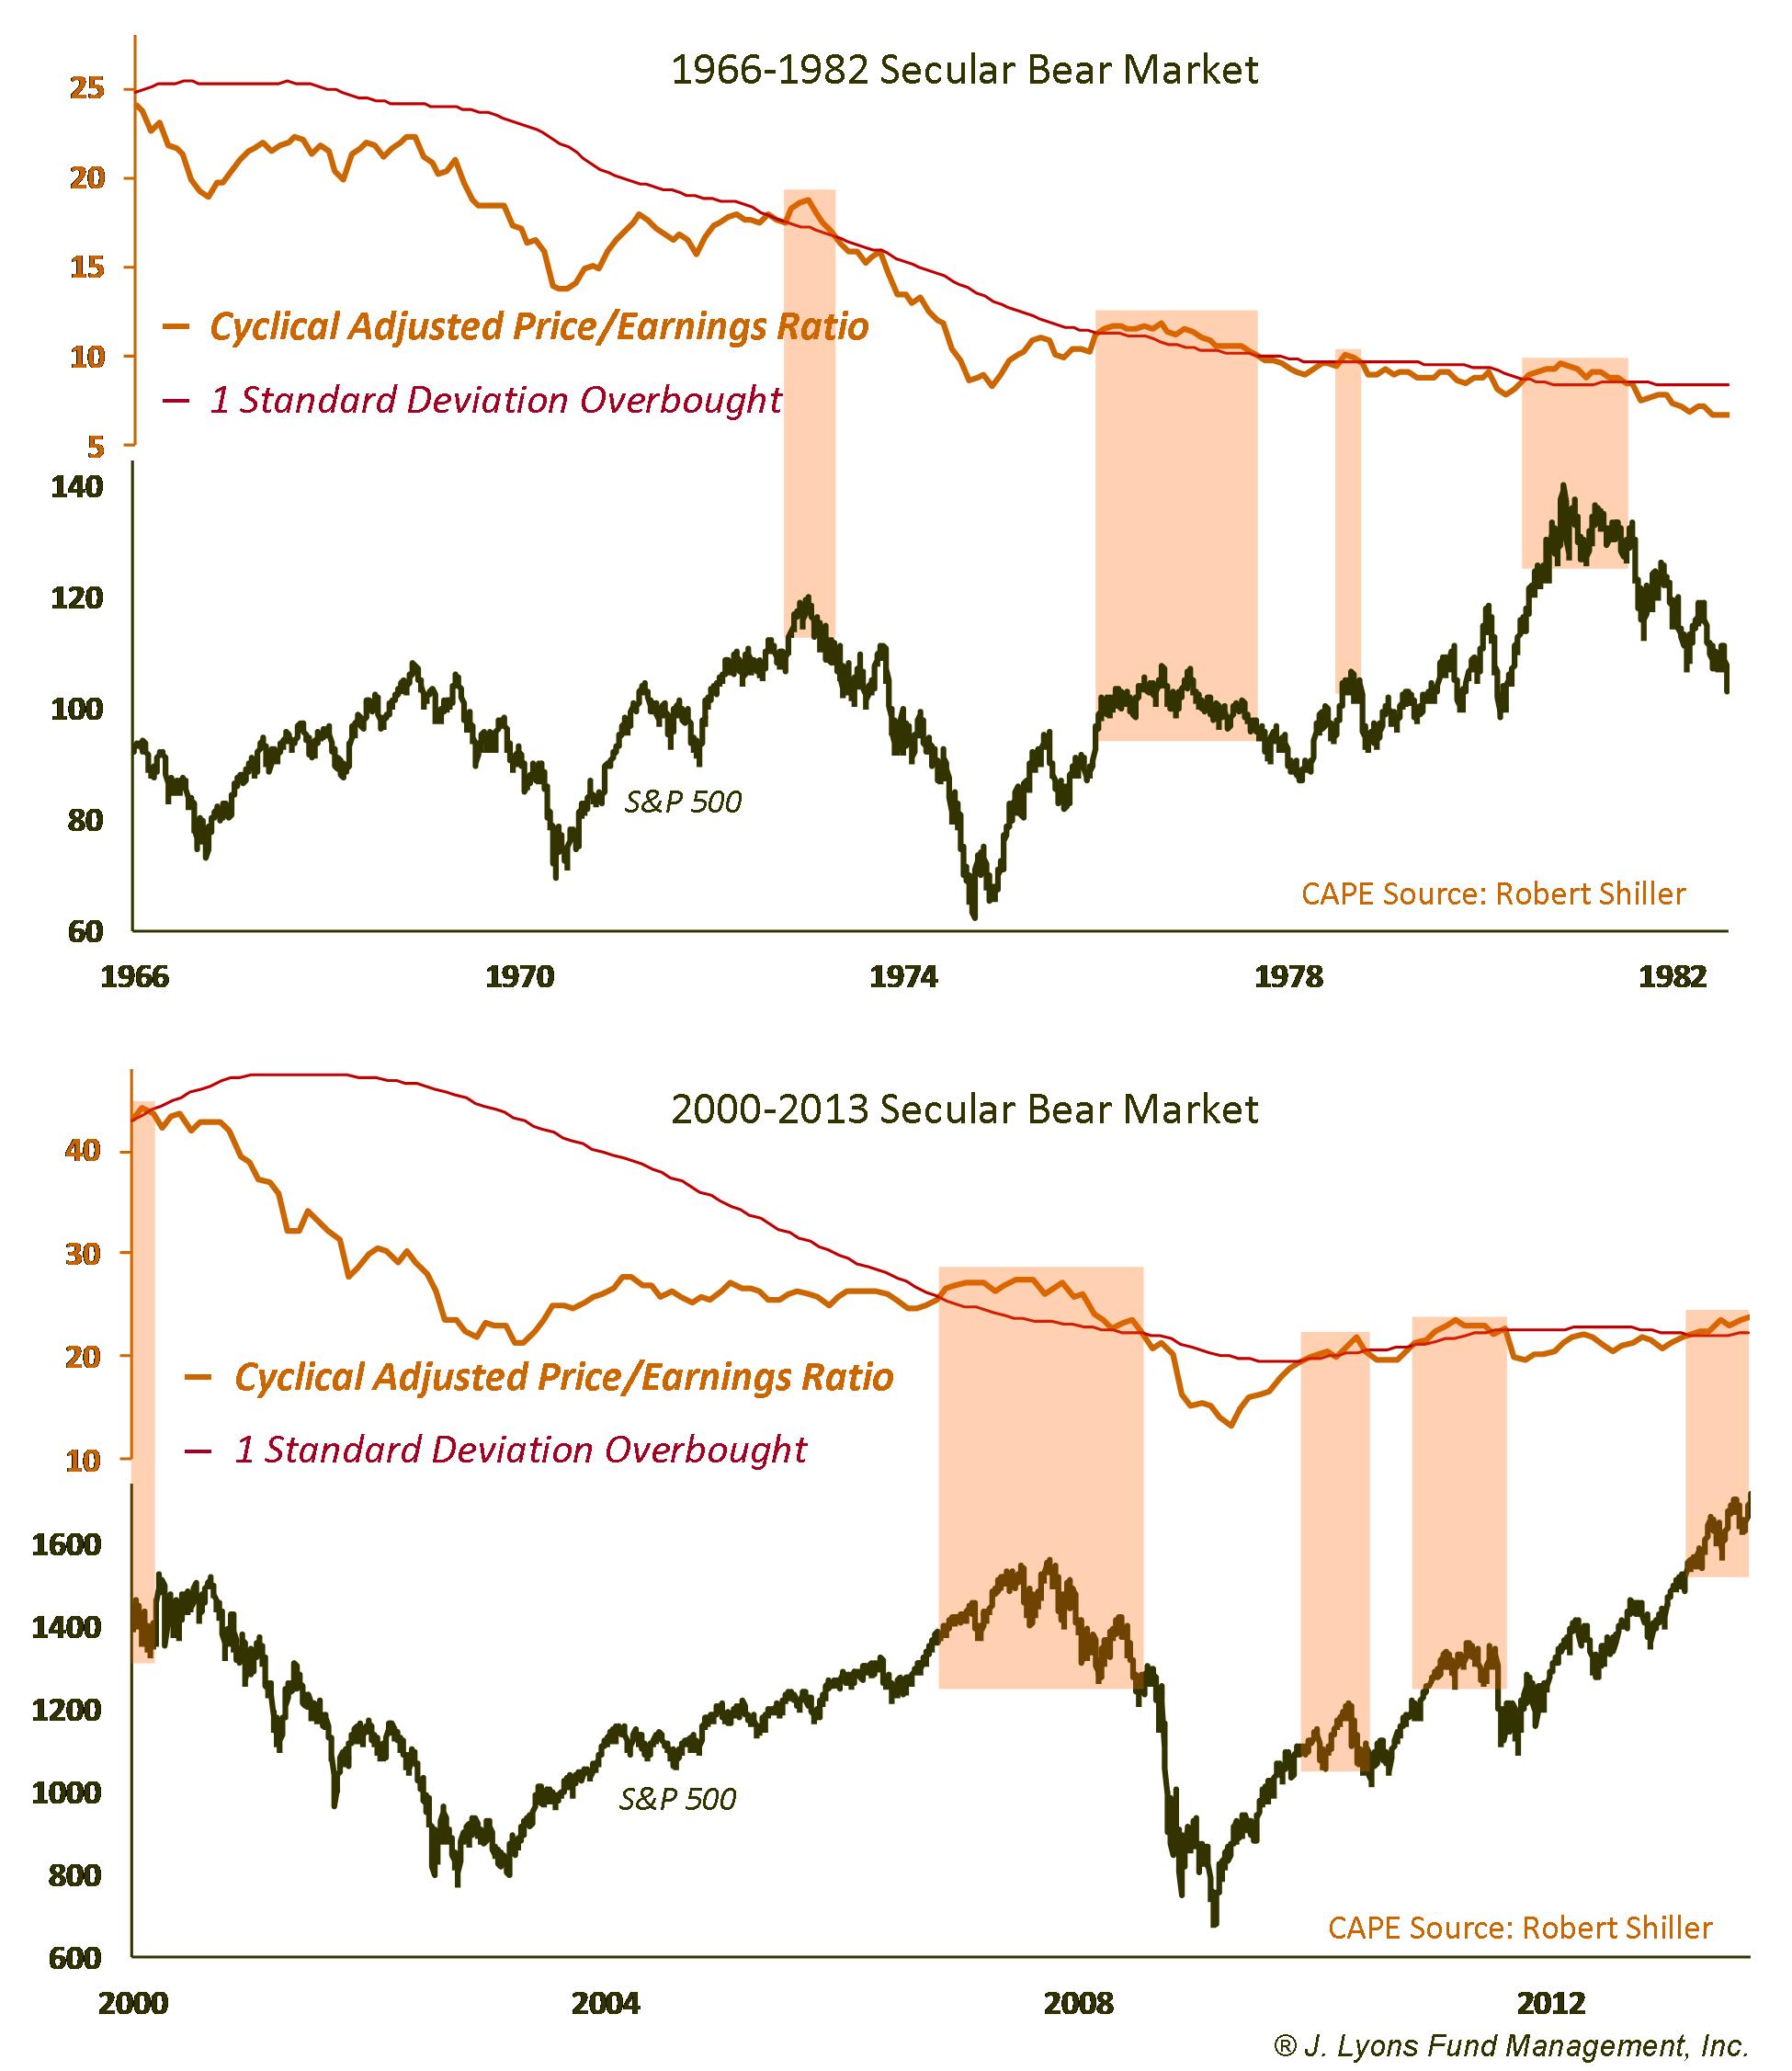
Valuation did not quite reach overbought levels at the market top in the late 1960's and did hit overbought levels at a few non-tops during the two periods, as well. However, like the other two measures, for the most part this overbought valuation condition has been a consistent marker of cyclical tops in secular bear markets. And like the other two measures, it is presently overbought.
Consensus of Overbought Conditions
While each of the 3 overbought conditions (price, sentiment and valuation) have been good indicators of cyclical tops, they all have their weaknesses. Furthermore, relying on any single indicator is inadequate, analytically speaking. To formulate a more robust and meaningful signal, we combined the three conditions to identify just those times when each of them were overbought. Those incidents are highlighted by the red boxes in the following charts.
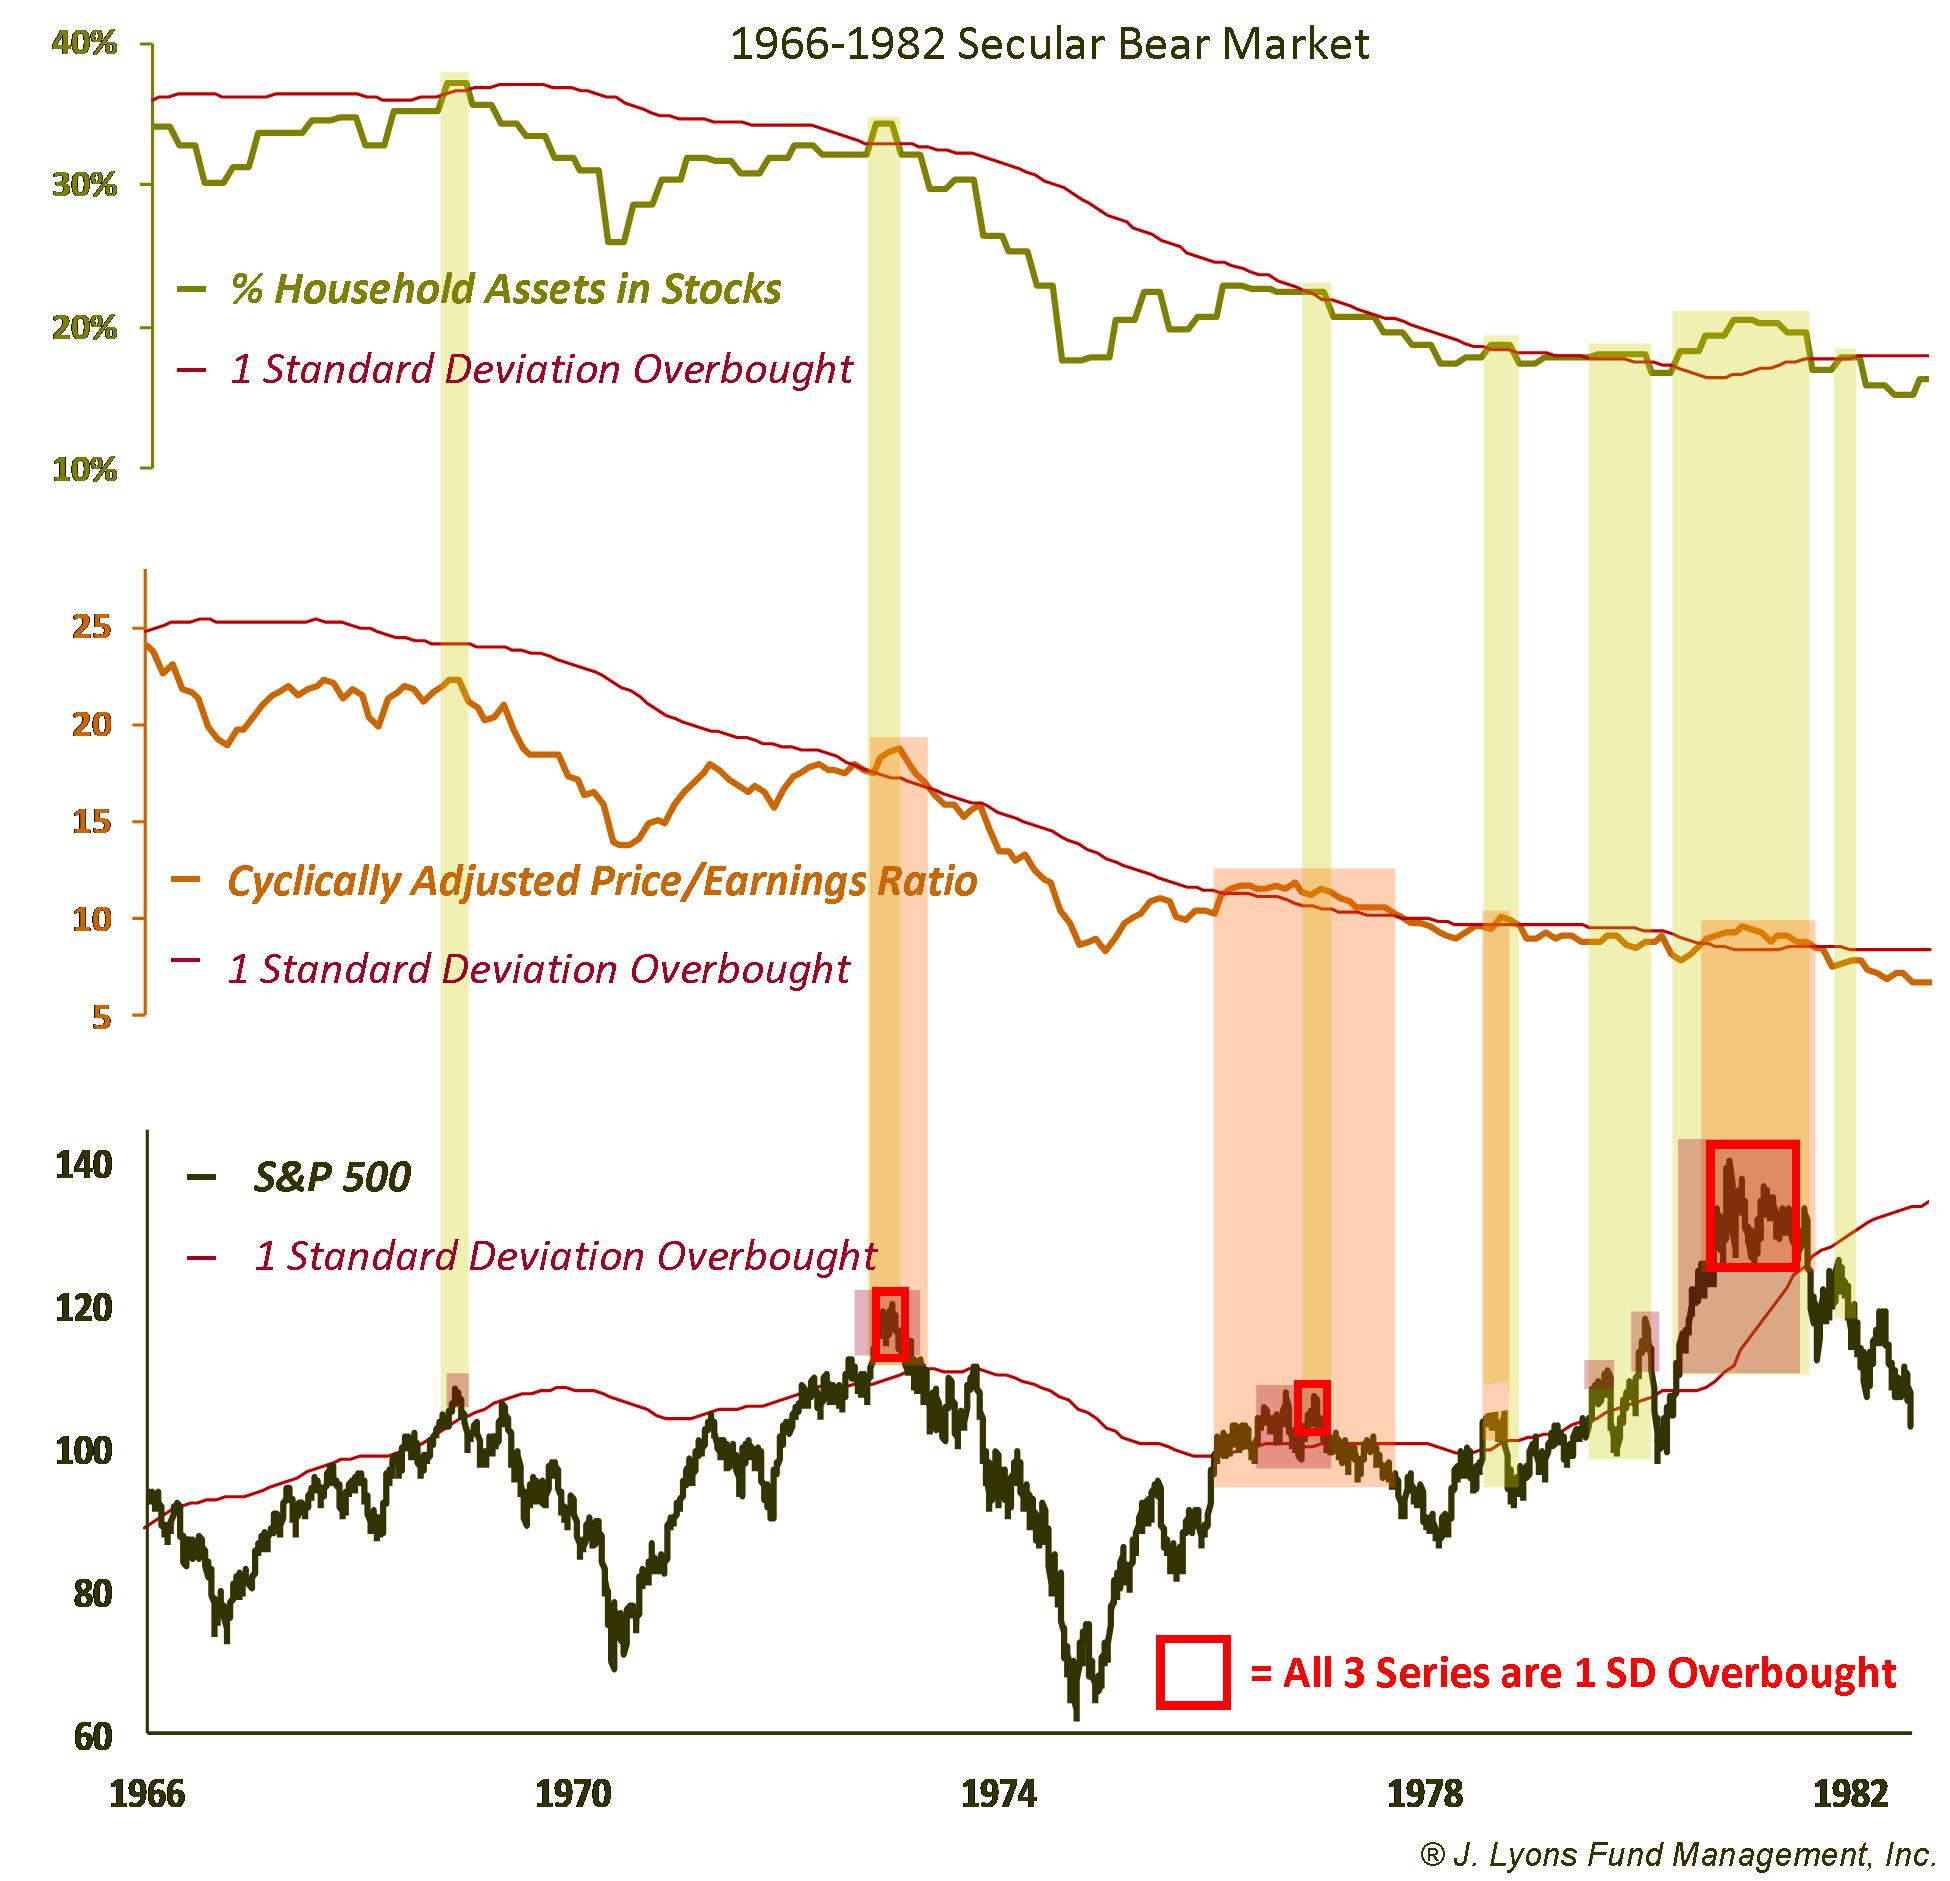
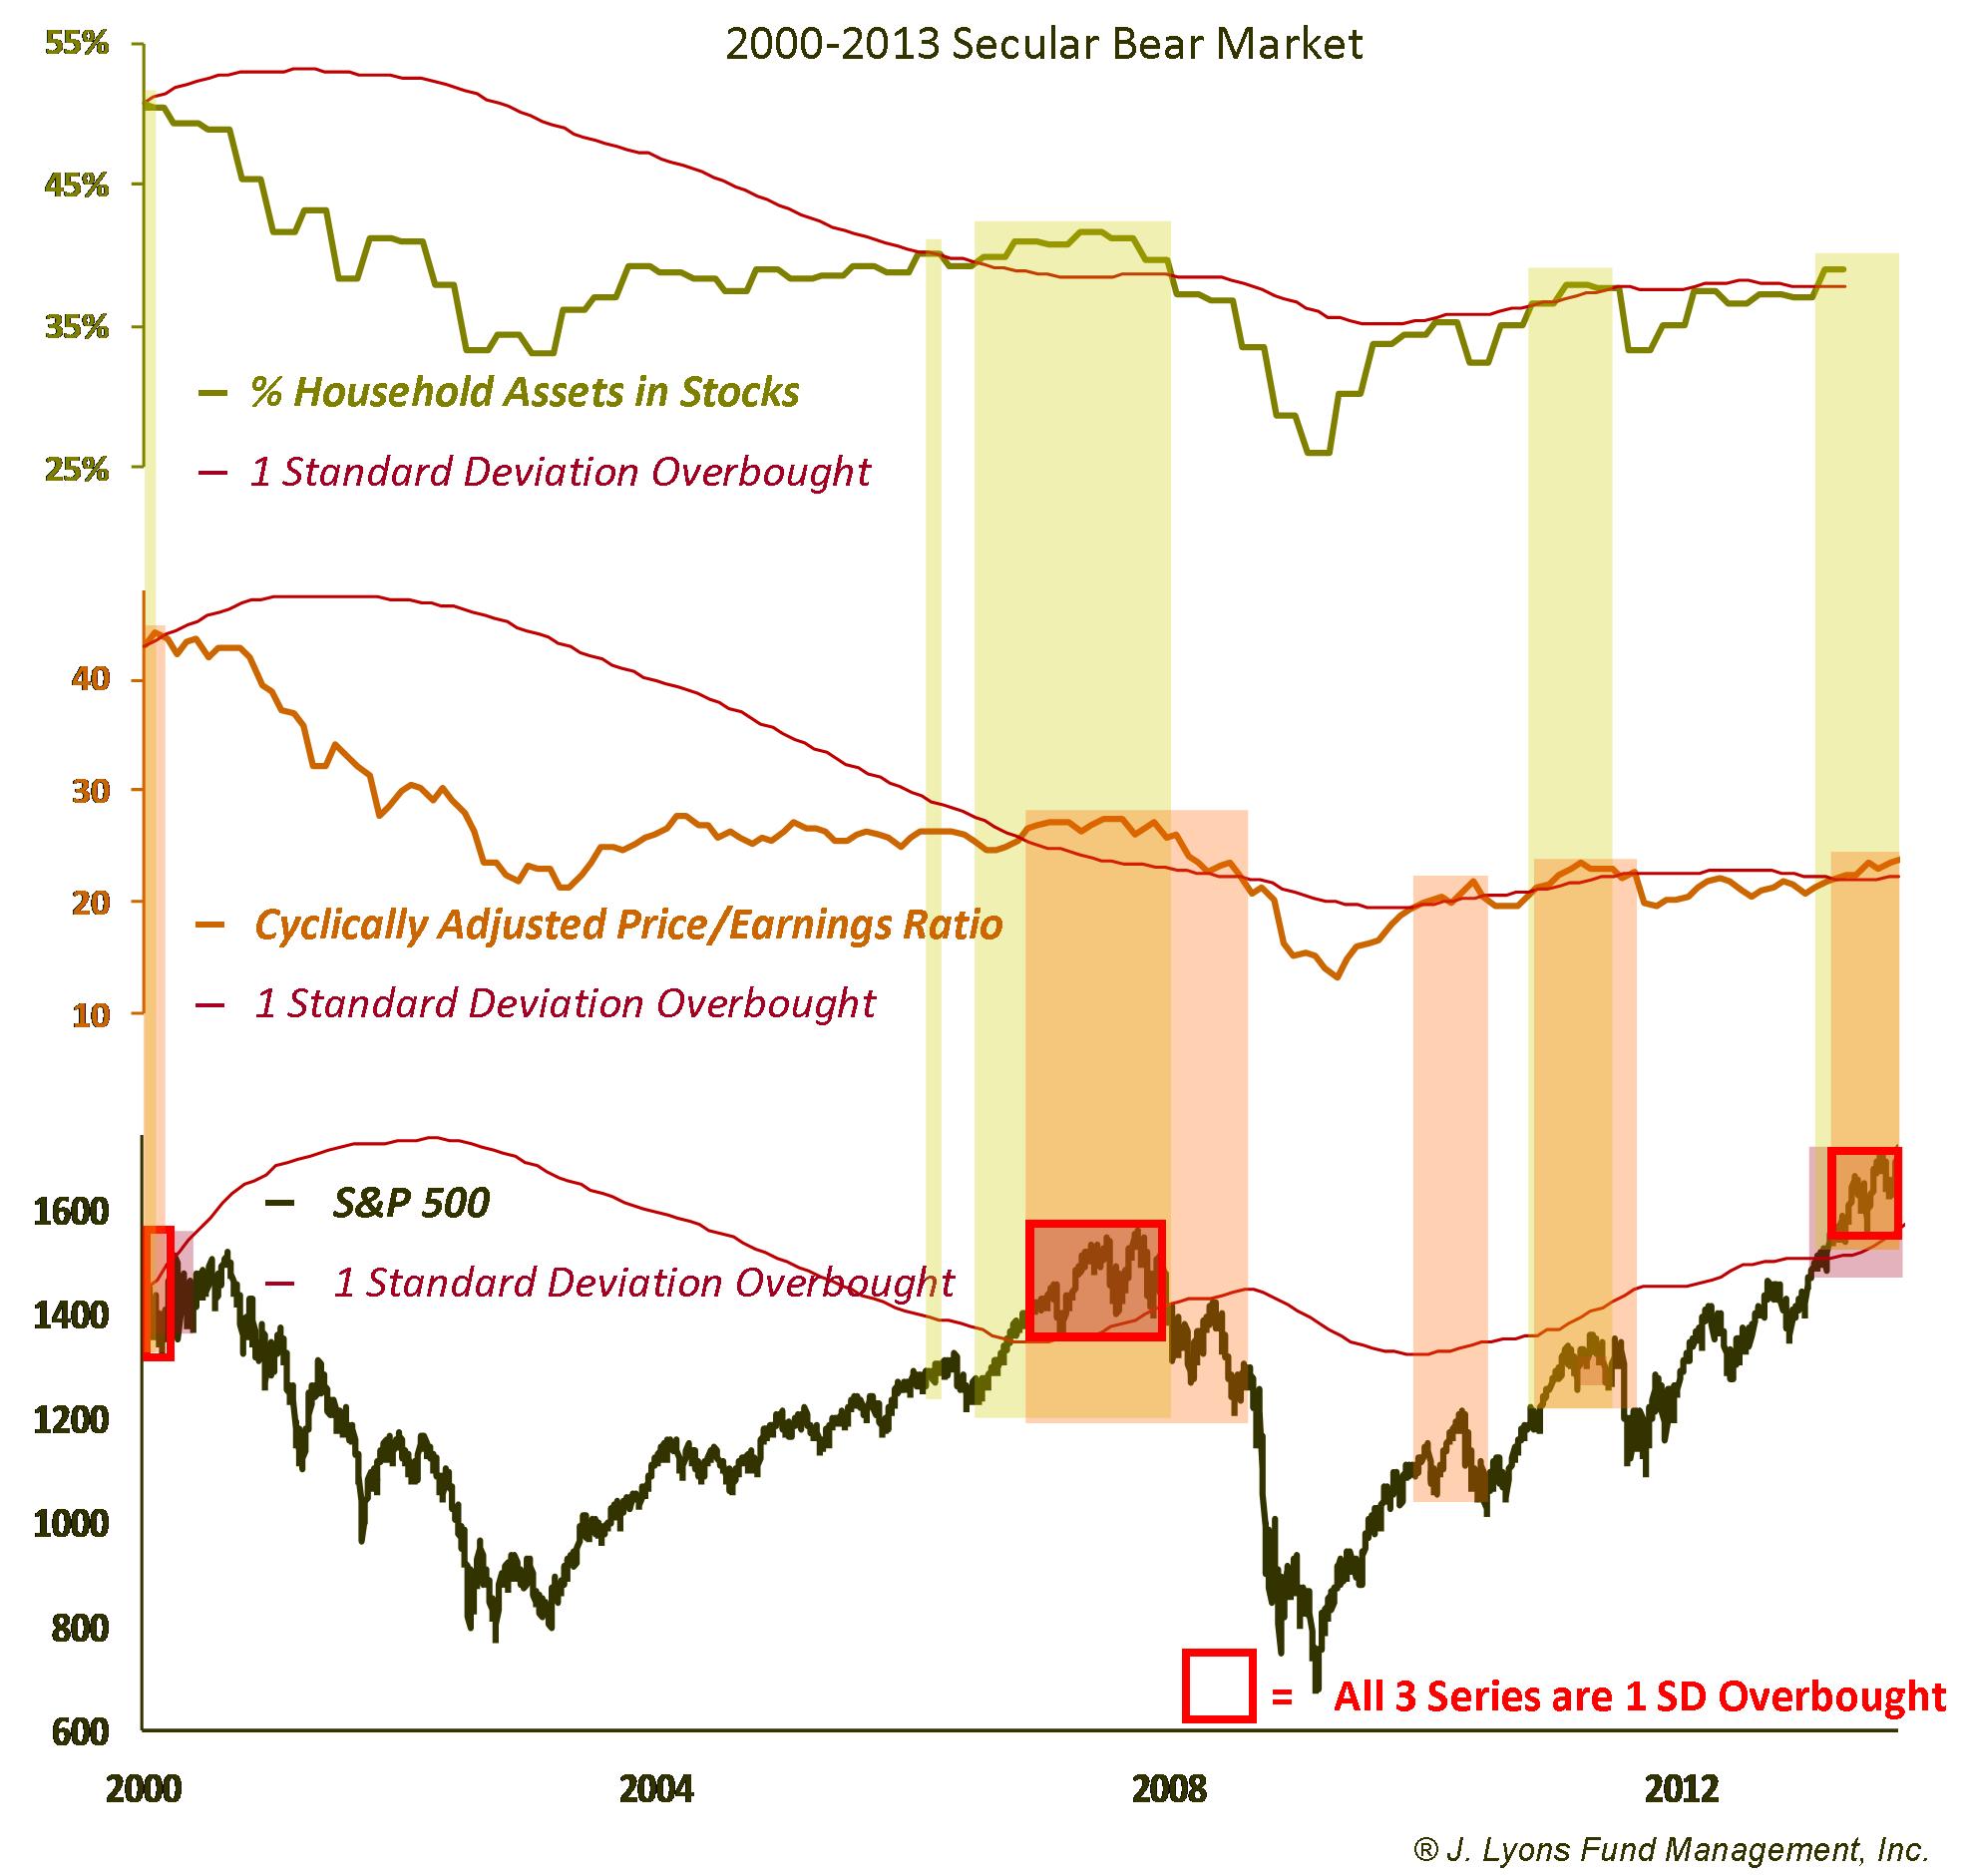
Targeting just those times in which price, sentiment and valuation were each overbought yields more effective signals. It weeds out the occasional "noise" signaled by one or two of the measures, leaving just the major, cyclical tops. Of course, due to the valuation metric failing to signal overbought in 1968, that top was not identified. Overall, however, the consensus of these conditions has provided consistent warning of cyclical tops and could have helped protect against significant subsequent losses. Be warned that these 3 conditions are now firmly in place.
| Date
Conditions First Reached |
Months until Cyclical Top | Max Gain to Cyclical Top | Months from First Date to Cyclical Low | Return from First Date to Cyclical Low | Loss from Top to Cyclical Low |
| October
1972 |
2 | 5.8% | 23 | -43.1% | -46.2% |
| September 1976 | 3 | 2.1% | 17 | -17.3% | -19.0% |
| July 1980 | 4 | 15.5% | 24 | -11.9% | -23.8% |
| January
2000 |
9 | 3.3% | 33 | -44.5% | -46.3% |
| October
2006 |
12 | 12.4% | 28 | -46.7% | -52.6% |
| Average | 5.8 | 7.8% | 25.0 | -32.7% | -37.6% |
Using a Trigger for Sell Signal
While these 3 overbought conditions preceded extended market declines and significant losses every time, there was some lag time between the point the overbought conditions were first reached and the actual market top, particularly during this current secular bear market. This could cause investors to give up some potential gains, or cause short-sellers losses while waiting for the market to top. Using some methodology to signal when the market uptrend has broken as a trigger to sell can alleviate that lag problem.
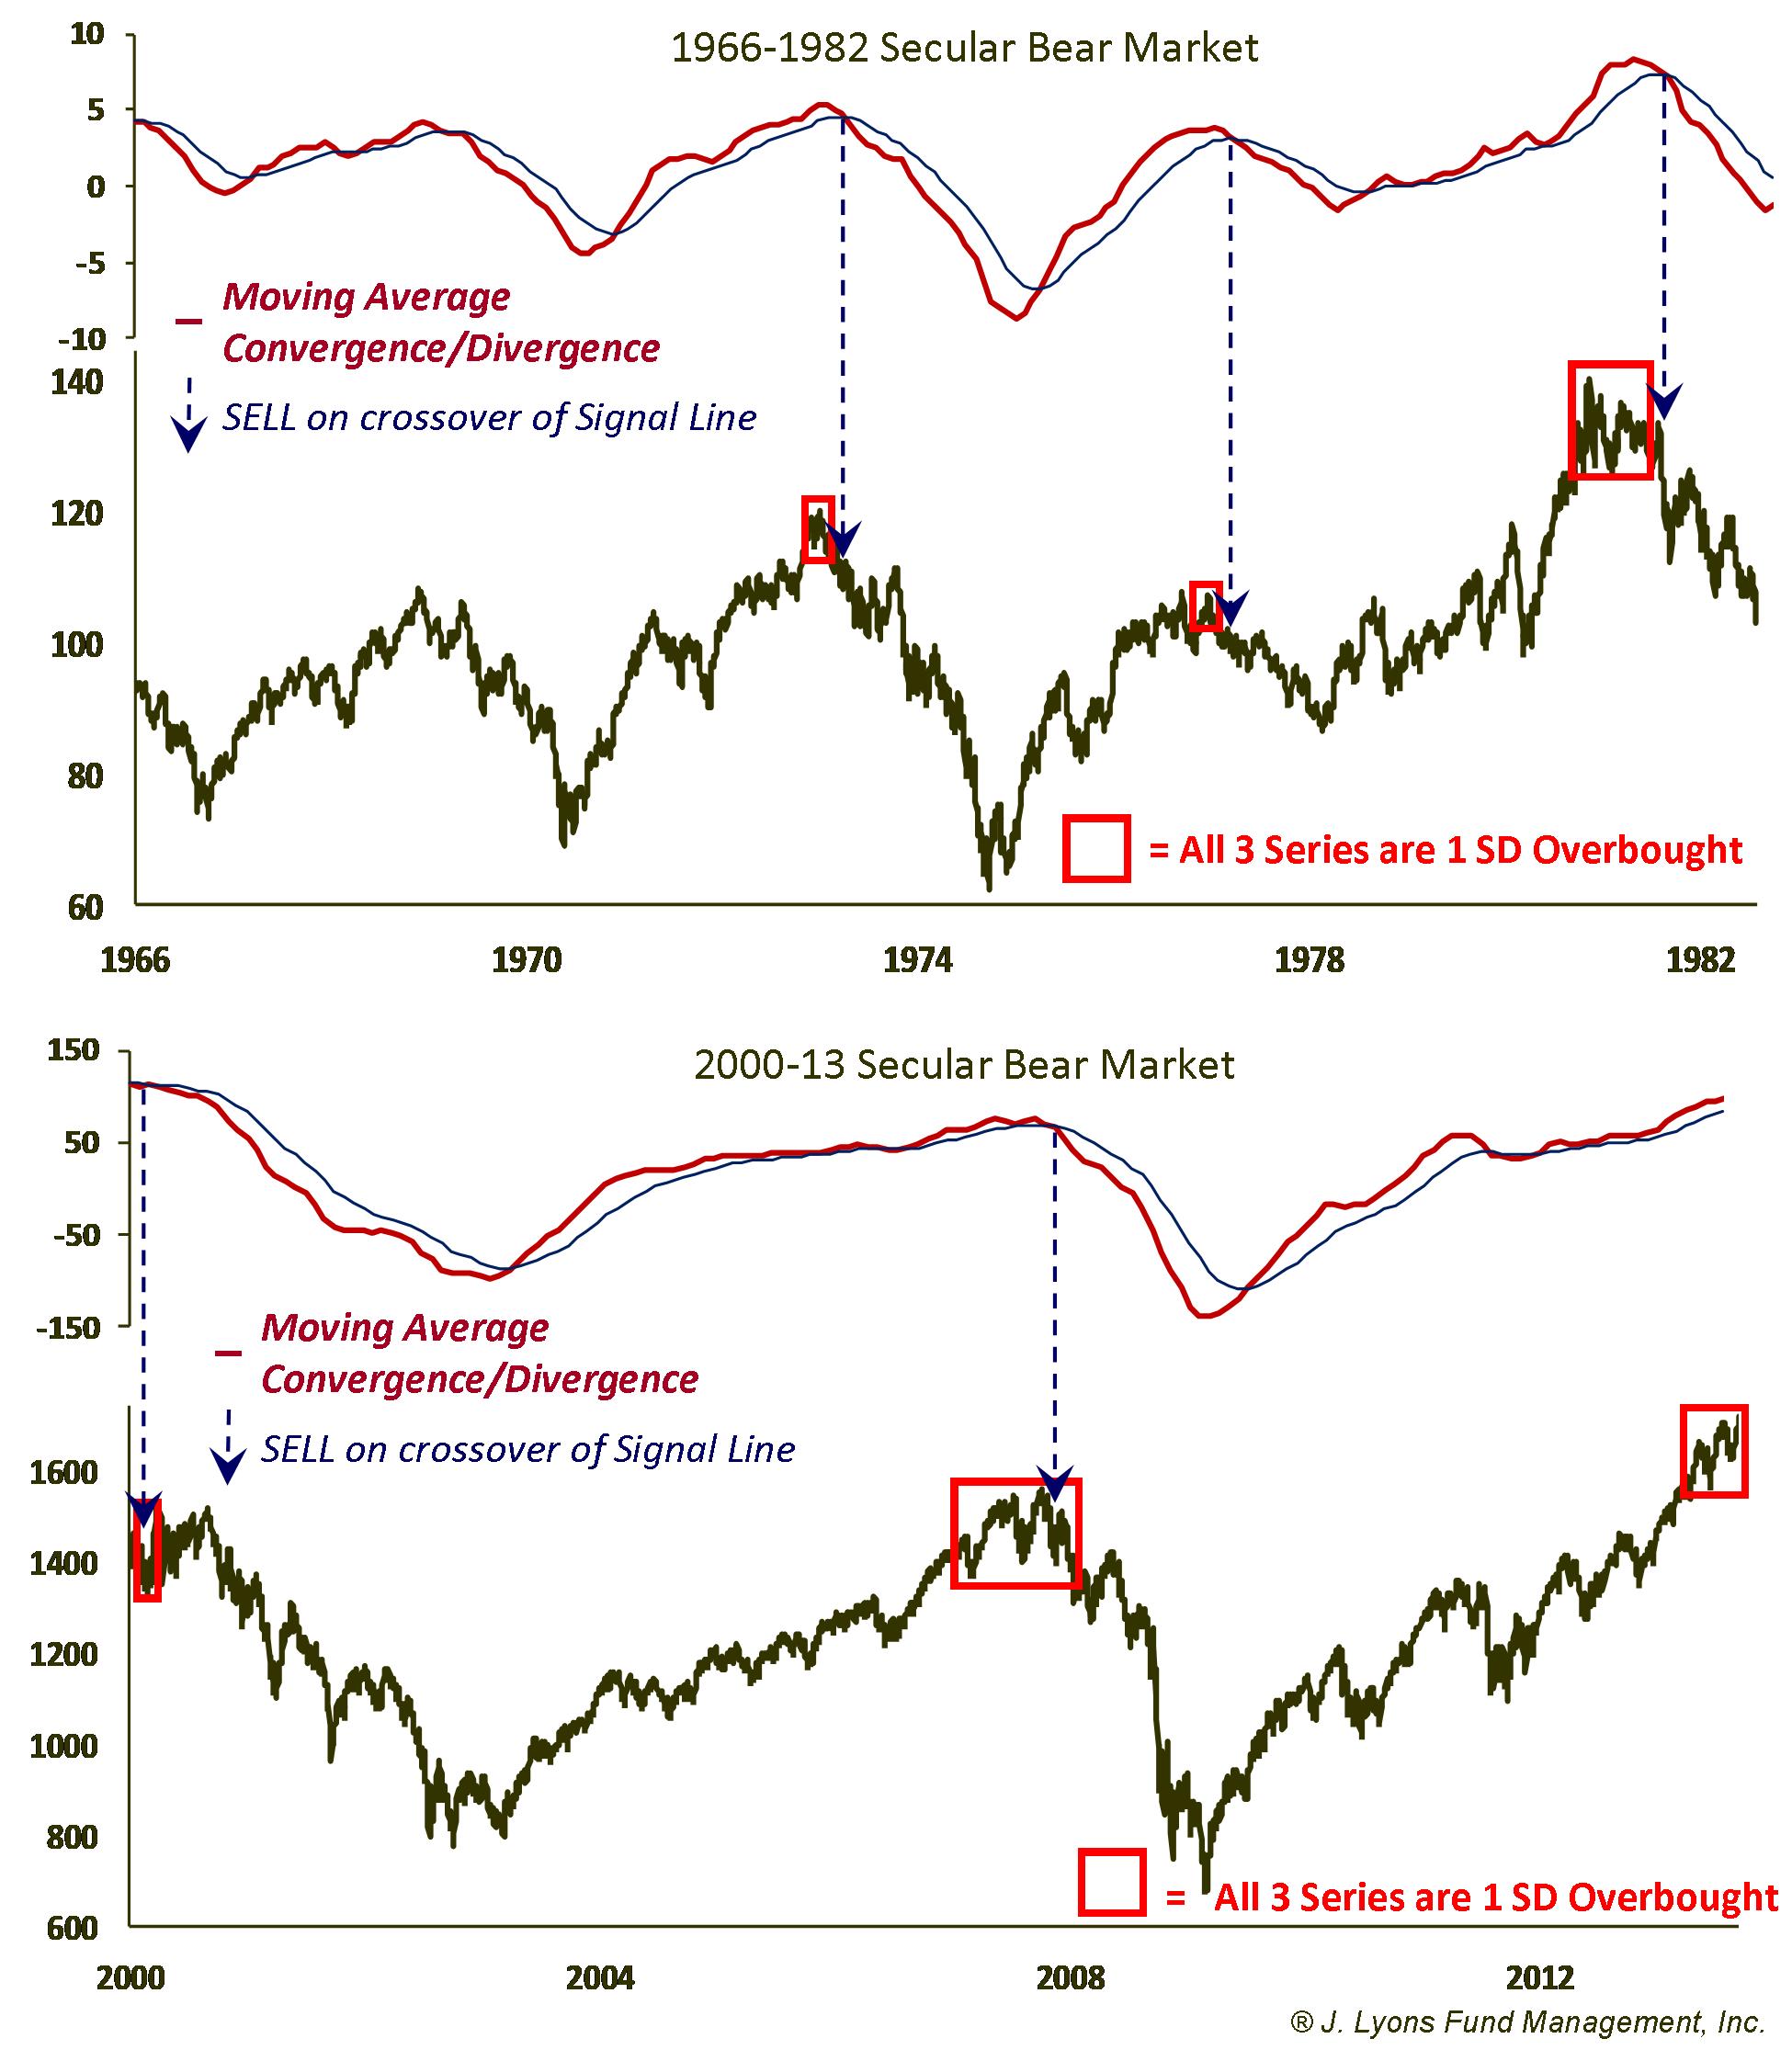
There are countless ways to signal trend changes. One common method is a technical indicator called the Moving Average Convergence/Divergence, or MACD. While a mouthful, it is basically a measure of the momentum or strength of a trend. When the MACD falls below a moving average (or signal line), it is an indication of a loss of momentum and a possible downturn in the market's trajectory. Waiting for the monthly MACD of the S&P 500 to turn down after overbought conditions have been reached in price, sentiment and valuation yields the following signals.
| Date
Conditions First Reached |
MACD Sell Date |
Max
Gain after MACD Sell |
Months from MACD Sell to Cyclical Low | Loss from MACD Sell to Cyclical Low |
| October
1972 |
April 1973 | 1.4% | 17 | -40.6% |
| September 1976 | March 1977 | 2.1% | 11 | -11.6% |
| July 1980 | July 1981 | 0.0% | 12 | -18.2% |
| January
2000 |
January 2000 | 3.3% | 33 | -44.5% |
| October
2006 |
December 2007 | 0.0% | 14 | -49.9% |
| Average | 1.3% | 17.4 | -33.0% |
Waiting for the MACD to turn down allowed investors to continue to ride the uptrend even after the 3 overbought conditions were reached. While this method means most likely missing the exact high in the market, it proved helpful in preventing a premature exit, particularly in 1980 and 2006. The MACD signal also proved extremely accurate in its role of "confirming" that the top was in. The average maximum gain following the signals was negligible at 1.3%, especially considering the average downside of -33%. A risk/reward ratio of 25:1 is about the best one will ever see.
The good news, for now, is that, despite the 3 overbought conditions, the S&P 500 does not appear to be in imminent danger of flashing a MACD sell signal. However, that lack of confirmation does not preclude the market from forming a top at any time.
Conclusion
The goal of the JLFMI Newsletter is to inform readers of the reality that markets go both up and down, even on a longer-term basis. Therefore, prudent investing should include some form of Active Management in order to control one's investment risk. This approach is designed to help investors avoid the scenario in which they find themselves shell-shocked as their portfolio is cut in half. This precise scenario has played out twice in the past 13 years is threatening to happen once again. The conditions we have identified in this issue, and which are present today, have resulted in market declines that lasted, on average, almost 2 years and lost investors, on average, over 37%. Unfortunately, we must compete with Wall Street's buy-and-hold circus callers that are currently pulling investor money into the market tent in record amounts. We only hope that our promotion attempt will encourage investors to take a different approach to managing risk instead of doing what they did during the previous 2 major declines...nothing.
Dana Lyons
The
commentary
included in this newsletter is provided for informational purposes
only. It does not constitute a recommendation to invest in any
specific investment product or service. Proper due diligence should be
performed before
investing in any investment vehicle. There is a risk of loss involved
in
all investments.