| June 2012 | Posted June 5, 2012 |
Three Times the Risk
Long, medium and short-term bearish stars are aligning
Preface: We had this newsletter in the hopper before the May market meltdown (not that our May Newsletter wasn't unambiguously bearish). Despite the substantial recent weakness, it is not too late to seek risk management measures for your retirement account or other investments. There will always be a need for risk controls, in general and specifically in the forthcoming environment. In other words, although the horse may be out of the barn, he is still on the property. Get control of him before he is gone.
When managing money, one of the greatest challenges is to weigh the various, existing positive factors against the negative ones to reach the appropriate and timely conclusion (that is, for those of us who actually manage risk and don't simply push a big BUY button regardless of market conditions like one of those bobbing Drinking Bird toys.) While one of the critical components of any successful investment strategy is an objective process or model with which to guide investment decisions, there are typically off-setting influences that may require tweaking one's process in order to optimally navigate a market. However, at rare times, all of the stars seem to align behind one likely outcome. We appear to be in the vicinity of such a time...and the outcome is not a positive one.
Of course, we are referring to "stars" metaphorically, not in the astrological sense (although based on their calendar, the Mayans are apparently pretty bearish as well, if you consider the end of the world a bearish event.) The stars we are looking at are durations or time frames. Most often, one time frame, (i.e., longer-term) may be a market-negative influence while another (i.e., shorter-term) might look positive for the market. A money manager has to weigh these competing forces and usually must pick the time frame whose influence is most important -- then proceed on that path with conviction.
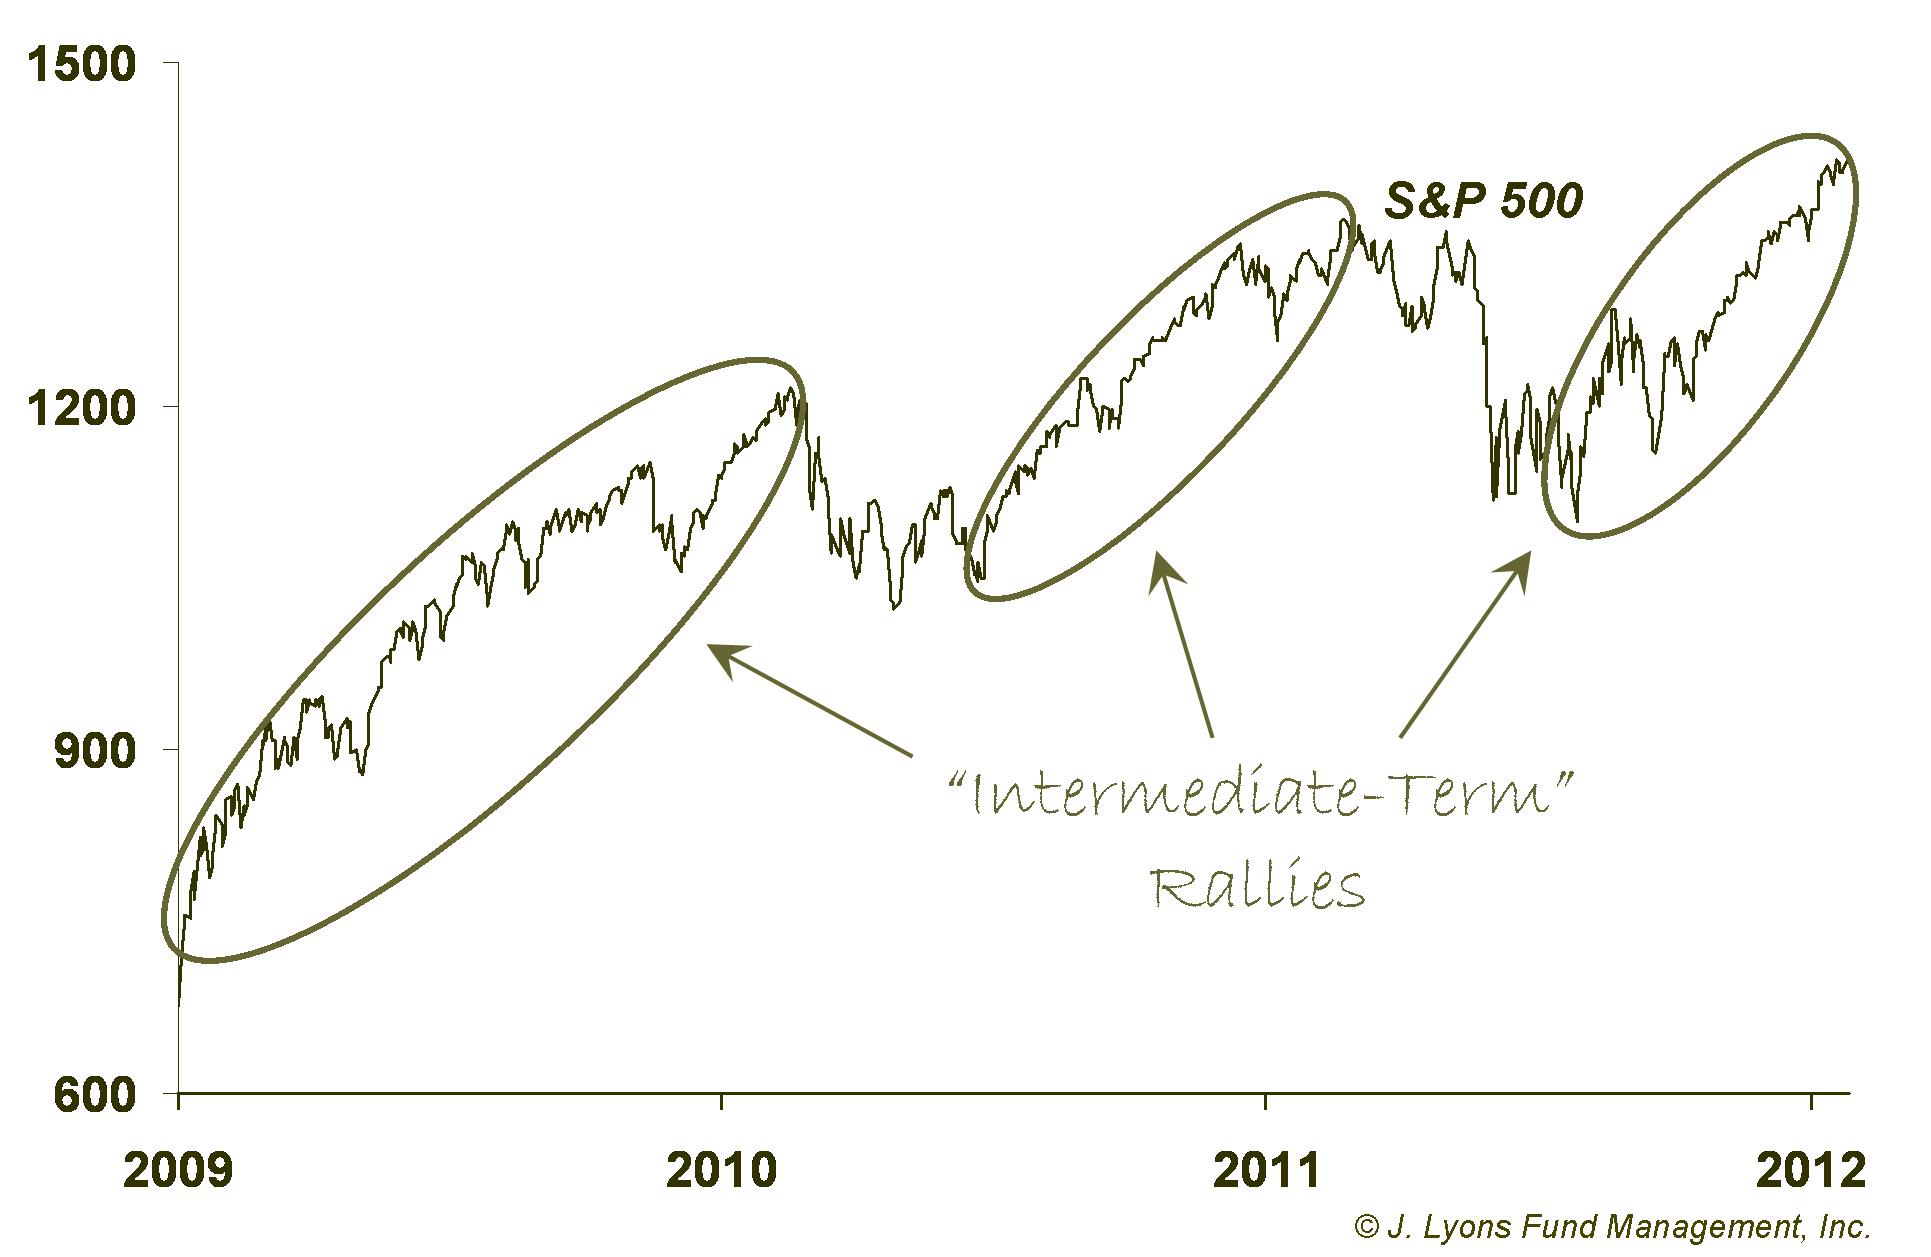
Sidebar: JLFMI's Risk Model is geared toward analyzing what we call the "intermediate-term", a duration on the order of months. For example, we consider the recent rally since the October 2011 low an "intermediate-term" rally. We believe the magnitude of market moves (around 10-30%, on average) within this time frame is the most appropriate for 1) attempting to profit from during advances and 2) attempting to avoid during declines.
As mentioned though, at times the implications suggested by the different durations are aligned with each other and form a consensus regarding the future path of the market. The present time appears to be one of consensus based upon our analysis of the market within the following time frames:
- Secular/Long-Term (measured on the order of decades)
- Cyclical/Medium-Term (measured on the order of years)
- Intermediate/Short-Term (measured on the order of months)
When these three time frames are aligned, the stock market is often at a critical juncture or inflection point. We believe that such a time is near (or here).
Disclaimer: While this study is a useful exercise, JLFMI's actual investment decisions are based on our proprietary models. Therefore, the conclusions based on the study in this newsletter may or may not be consistent with JLFMI's actual investment posture at any given time. Additionally, the commentary here should not be taken as a recommendation to invest in any specific securities or according to any specific methodologies.
Secular/Long-Term
We have illustrated ad-nauseum the repeating long-term pattern in the stock market, which we call the secular cycle. Although sell-side analysts and market pundits with a vested interest in rising stock prices will deny the cycle, its existence is plainly obvious to any objective observer from a mere glance at a long-term chart.
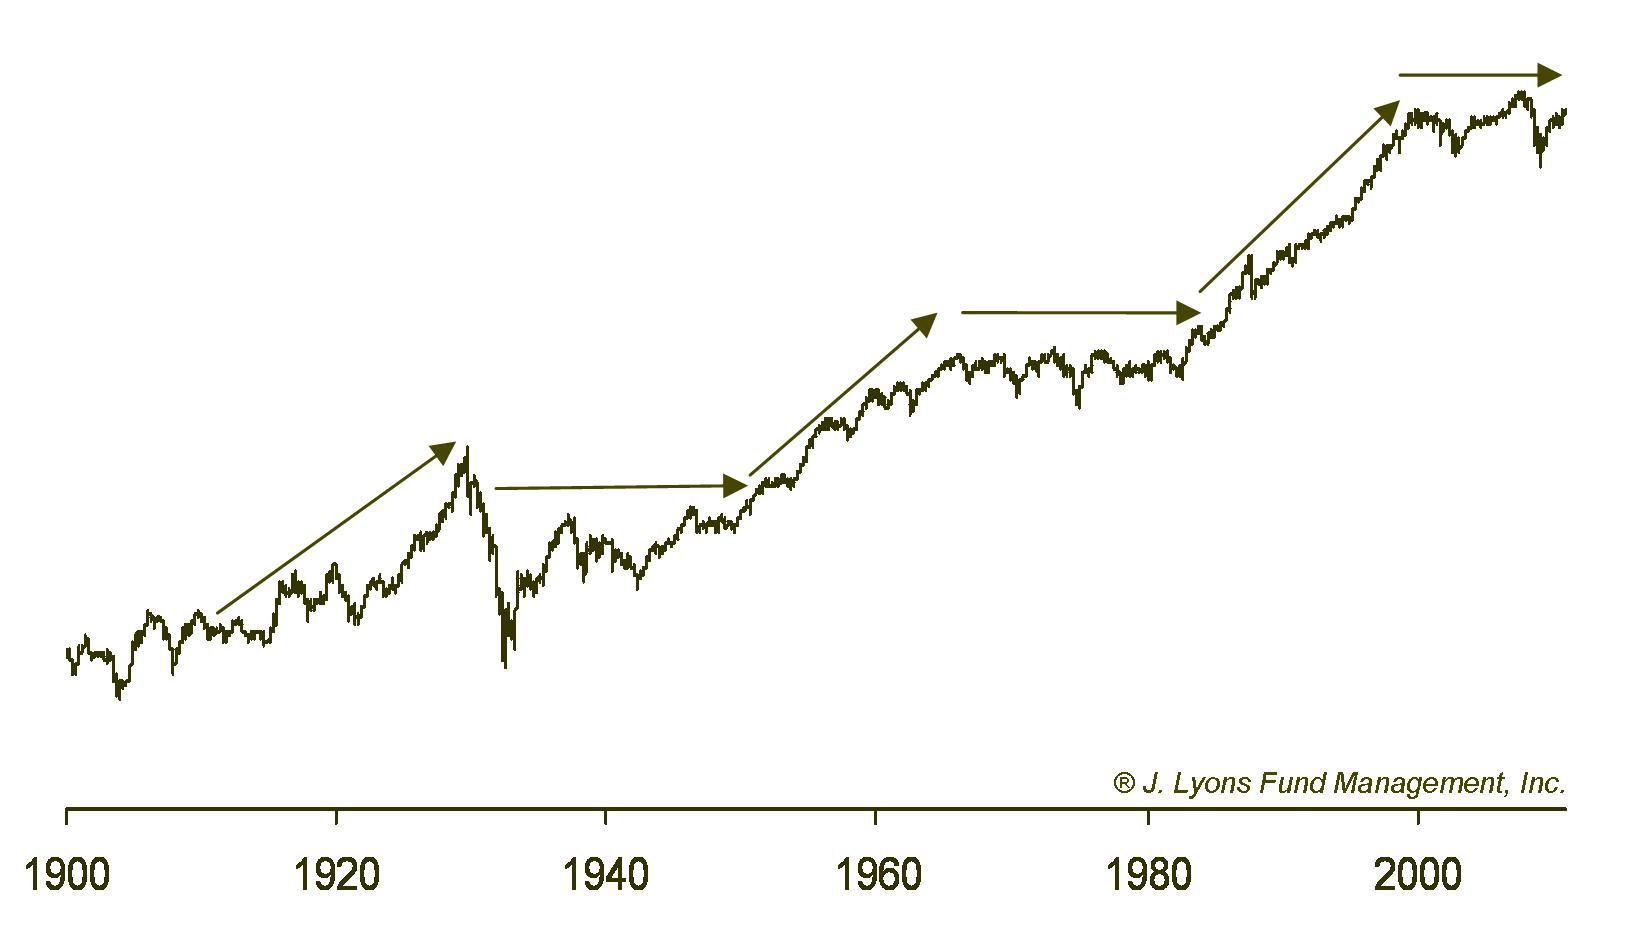
Since 1900 (and, in fact, much further back), the stock
market has demonstrated a clear pattern of alternating secular bull and
bear markets, each lasting 15-20 years. The bull markets are long
rallies that make successive, sustainable higher highs, like the move
from 1982 to 2000. And the secular bear markets generally move sideways
over the 15-20 years, with intermittent wide swings down and up along
the way. The market is currently within the confines of a secular bear
market that began in 2000 and which is likely to persist for the better
part of this decade.
If secular bear markets span up to several decades, one may wonder why this long-term "star" is beaming bearish signs right now. Aren't market implications always bearish in a secular bear market? Technically speaking, yes. However, as mentioned, secular bear markets are marked by significant swings both up and down, so the negative influence on the market is more pronounced at certain times in the secular bear cycle. The risk is high that the market is approaching one of those down swings now for a couple of reasons.
Secular Bear Market Range
As risk managers, we are always seeking to define our risk relative to the potential for reward. One benefit to identifying (or accepting) the existence of a secular bear market is that we know that the market is most likely bound in a range for an extended period of time. 12 years into the current secular bear, that range has been clearly defined at this point. Therefore, we can easily measure the expected potential upside (reward) and potential downside (risk) from current price levels.
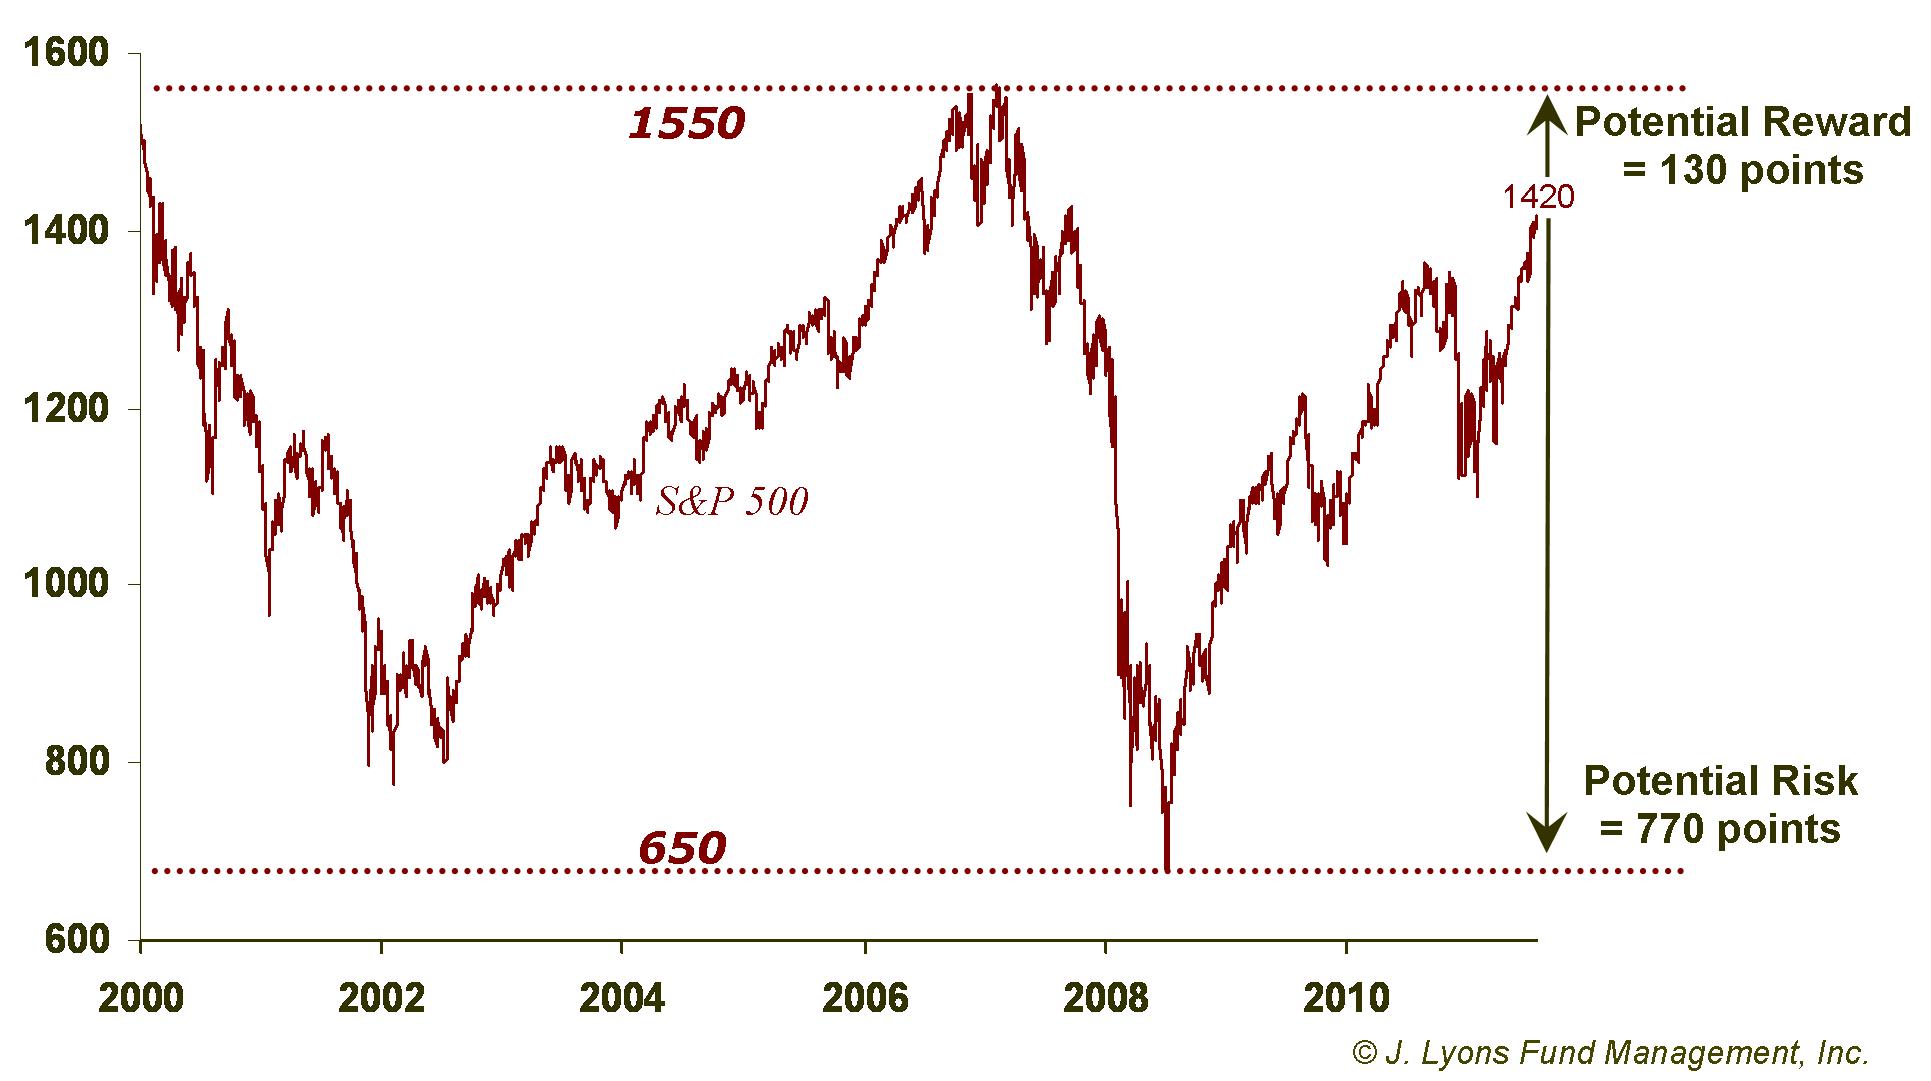
The
recent top in the S&P 500 was approximately 1420. From that
price
to the top of the 12-year secular bear market range of around 1550 is
130 points, or about 9%. Provided that top of the range holds, that is
the current potential reward in the stock market. On the other hand,
the potential risk down to the bottom of the secular bear range (call
it 650) is 770 points, or 45%. So the risk/reward ratio is 45% to 9% or
5:1. Unless one is an avid Keno player, those are not the sort of odds
that should lead an investor to embrace an aggressive investment
posture
at this juncture.
Secular Bear Market Composite Comparison
Several years ago, we constructed a Secular Bear Market Composite using the price data of the Dow Jones Industrial Average during the previous two secular bear markets, those occurring from 1929-1949 and from 1966-1982. This was in an effort to both ascertain "typical" market behavior during a secular bear as well as to instruct others regarding our secular bear thesis -- that secular bears occur regularly, that a secular bear is currently unfolding and what one should expect during such a period.
Although the construction of the composite was intended to illustrate the general pattern of a secular bear market, it has been remarkable, even to us, how closely the current market has tracked the composite since we first introduced it.
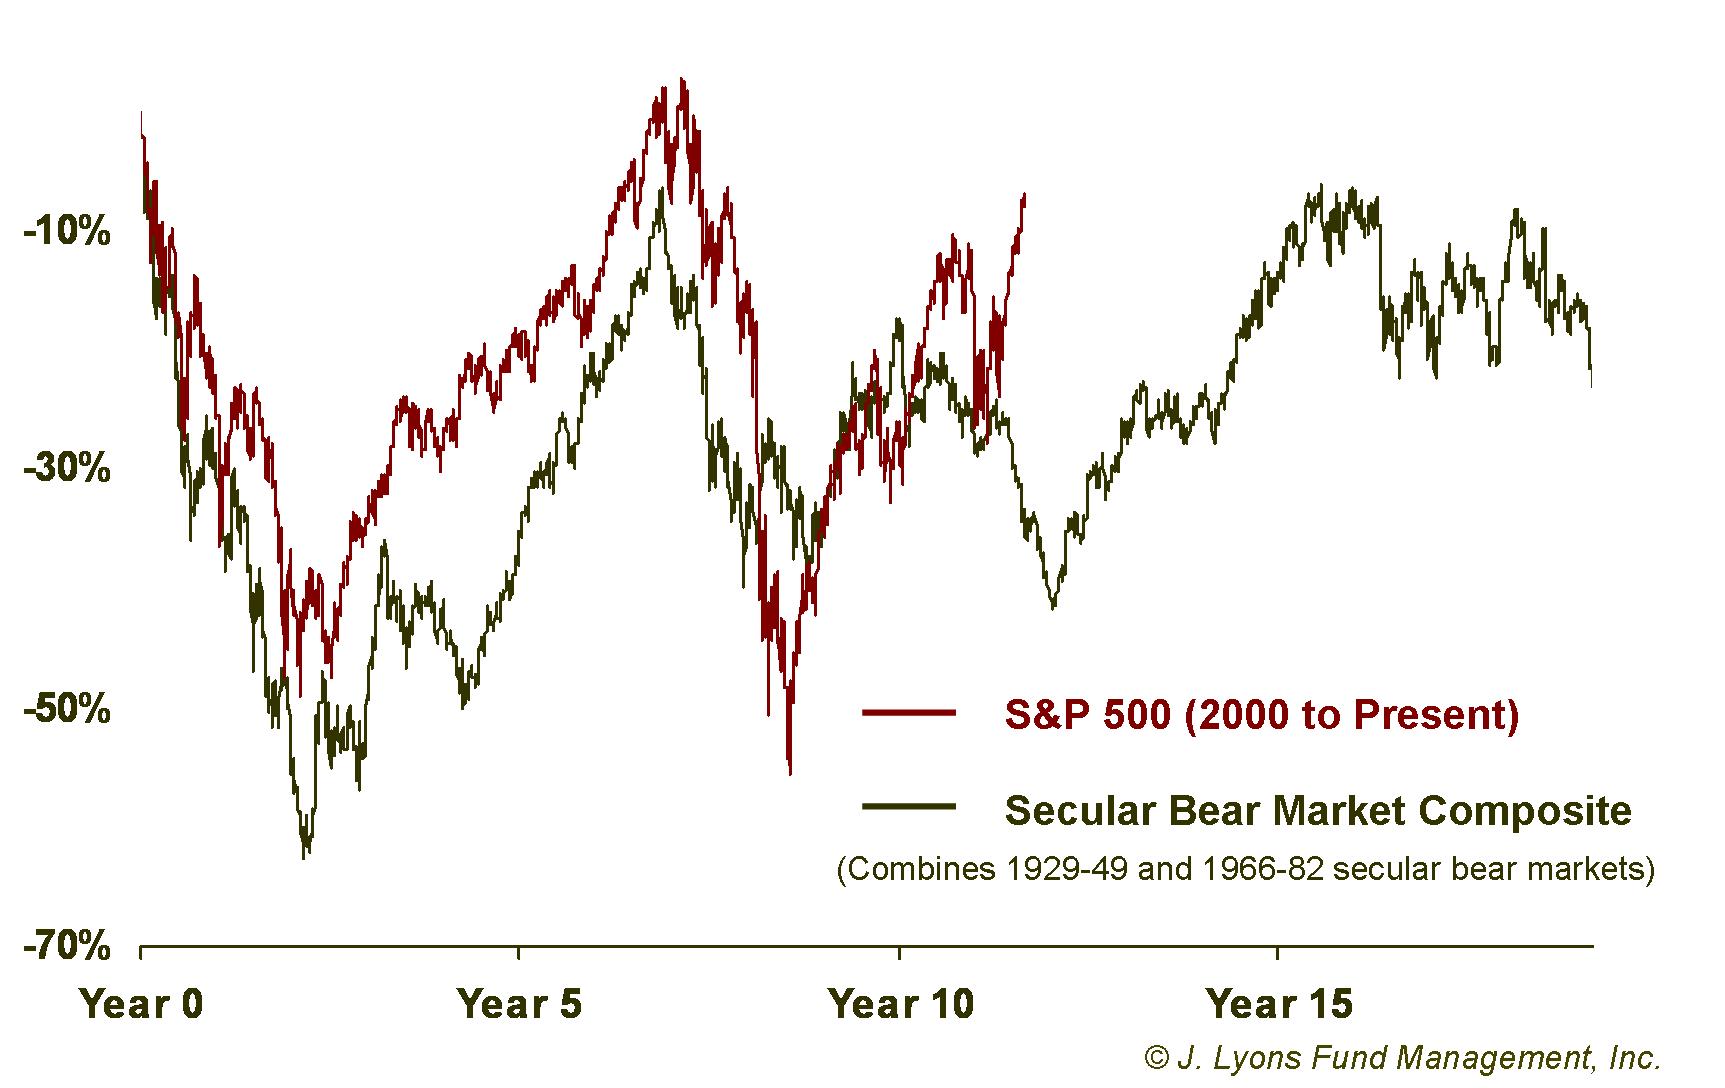
As
we have stated previously, the further we move
away from the beginning (2000) of the current secular bear, the more
likely the market is to diverge from the composite, at least in the
short-term. The market is presently showing such a divergence. The
current market is registering a positive deviation of 25% above the
level of the Secular Bear Composite, a margin it has reached only two
other times since 2000.
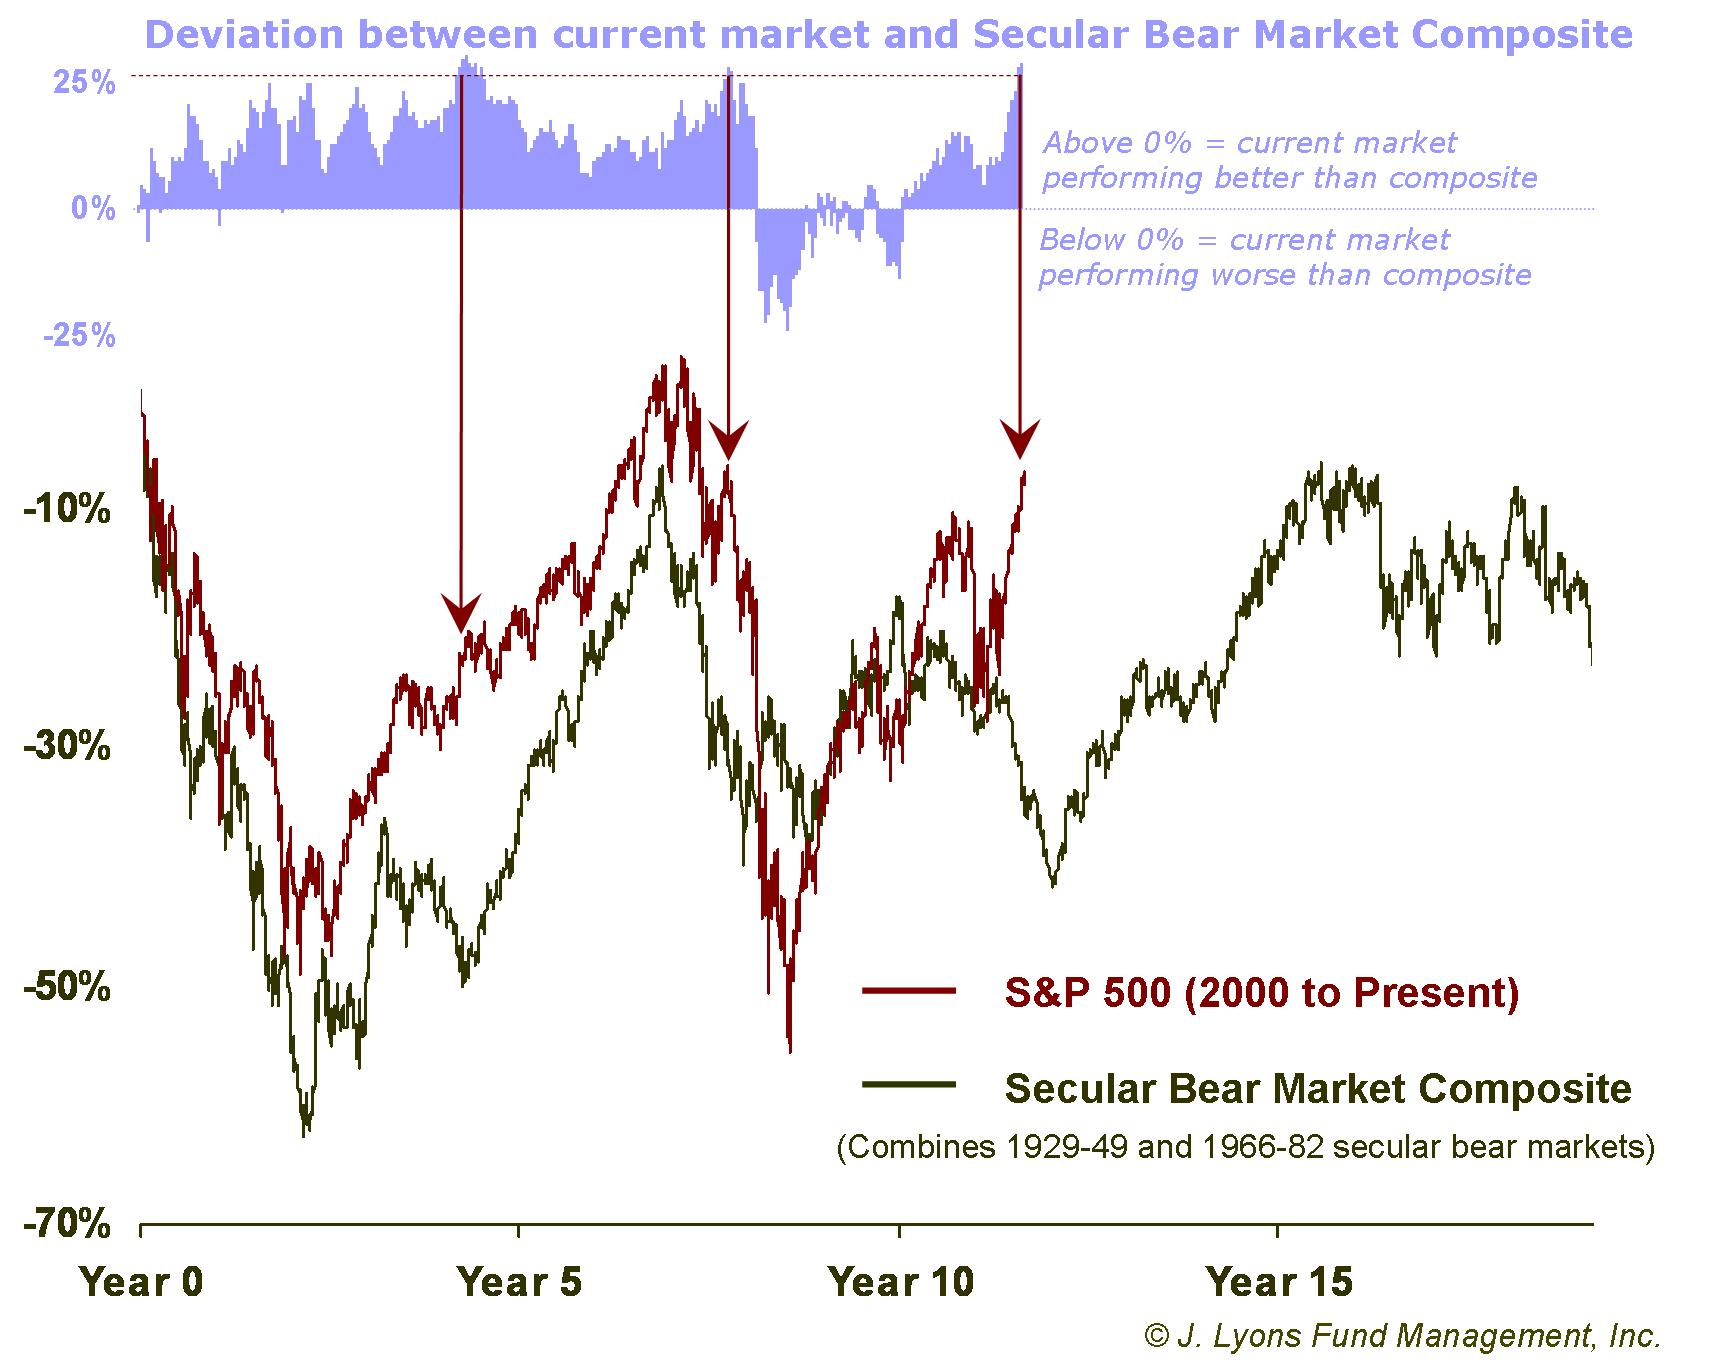
The
previous occasions that saw the market deviate 25% above the Secular
Bear Composite were late 2004 and May 2008. After the 2004 incident,
the stock market moved generally sideways for the next 11 months before
resuming the post-2003 rally. The May 2008 occurrence, as one may
recall, preceded a 50% drop in the S&P 500 over the subsequent
10
months into the March 2009 low.
The question is whether this is the beginning of a divergence between the stock market and the secular bear composite that will result in the present market escaping the confines of typical secular bear market behavior, or whether we are due for a mean-reverting move between the market and the composite. Our guess is that the latter scenario unfolds for a number of reasons.
First, the reason secular bear markets occur is due to various excesses being built up in the economy and stock market during a preceding secular bull. These excesses need to be expunged or worked off before the next secular bull can commence. These excesses have been wrung out to some extent over the past 12 years. However, as we have outlined before, many of the areas of excess are nowhere near the point of repair yet where they can support a new secular bull market. Additionally, the market is more than three years into a cyclical bull market that is due to expire.
Cyclical/Medium-Term
Examining the medium-term, or "cyclical" time frame, leads to a similarly downbeat conclusion. We define cyclical moves in the market as those typically spanning up to several years in length. The wide up and down swings within a secular bear market that we often refer to are cyclical moves. For example, within the current secular bear market, the rallies from 2002 to 2007 and from 2009 to the present constitute what we consider cyclical bull markets.
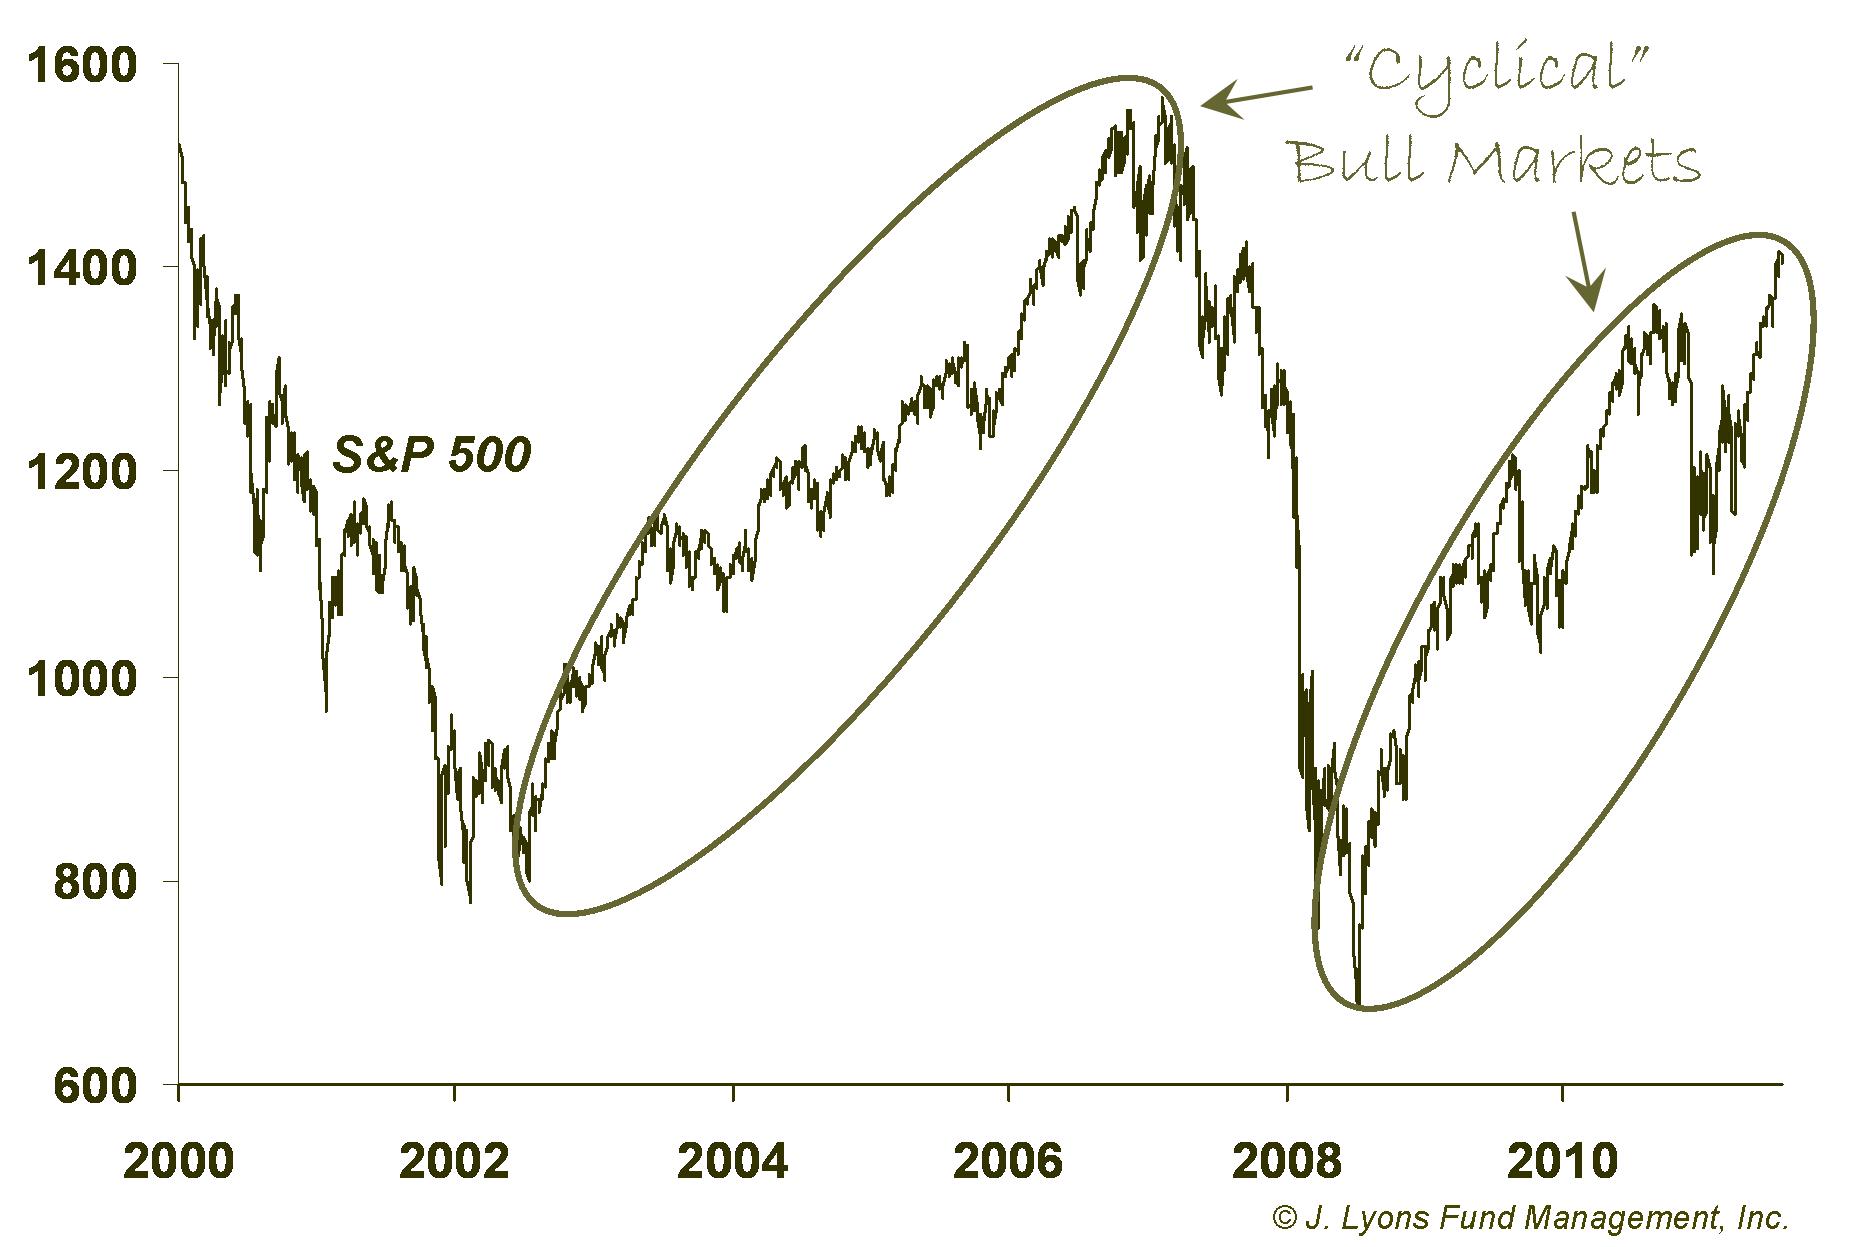
Since 1929, there have been 9 cyclical bull markets occurring within
secular bear markets, including the current move up since March 2009.
As we alluded to above, based on various historical metrics, the
current cyclical bull market is due to expire at any time now.
Cyclical Bull Market Returns
The average return during those 9 cyclical bull markets since 1929 is 111%. This number is greatly skewed, however, by the cyclical rally off the 1932 post-crash low. Excluding that massive 359% move, the average of the other 8 cyclical bulls is 77%.
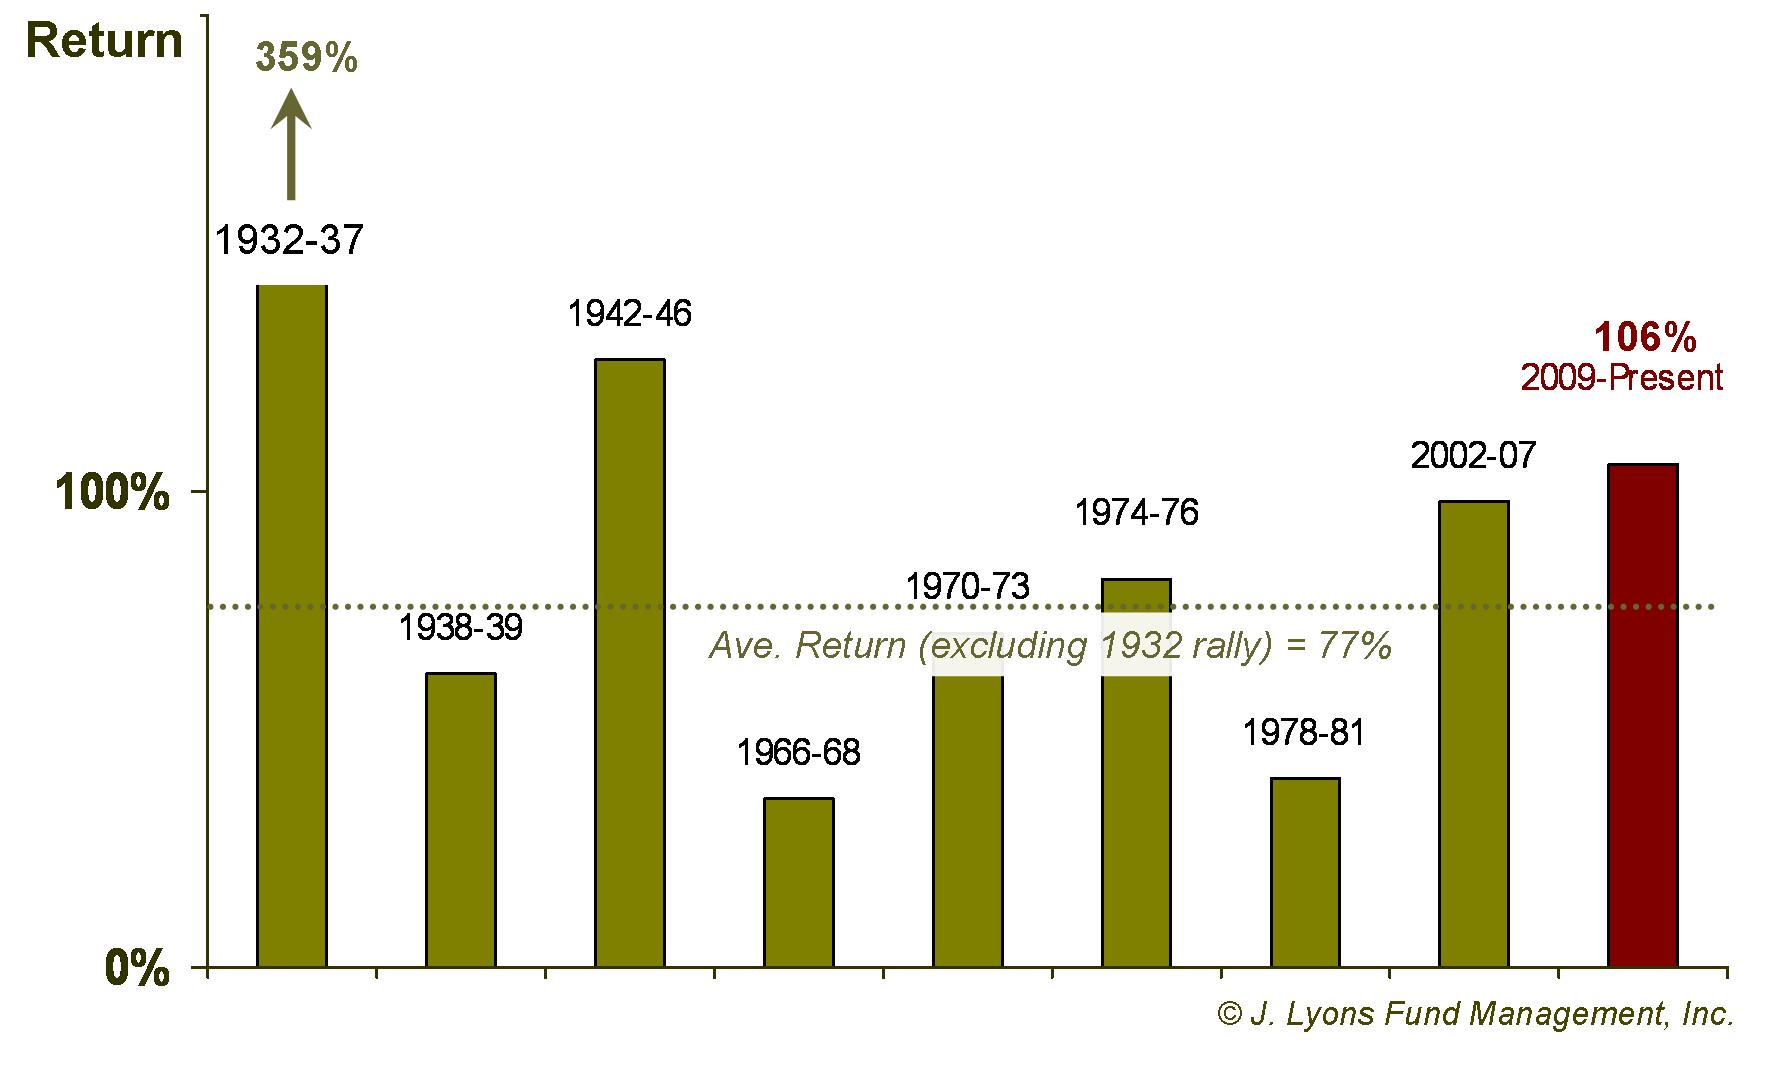
As the table illustrates, with a 106% return, the current
cyclical bull market is well above average historically, excluding the
monster 1932-37 rally. In fact, there has been only one
cyclical
bull market (1942-46) during the last 75 years with a higher return. To
expect the cyclical bull to proceed much further from here would be
going against the historical grain.
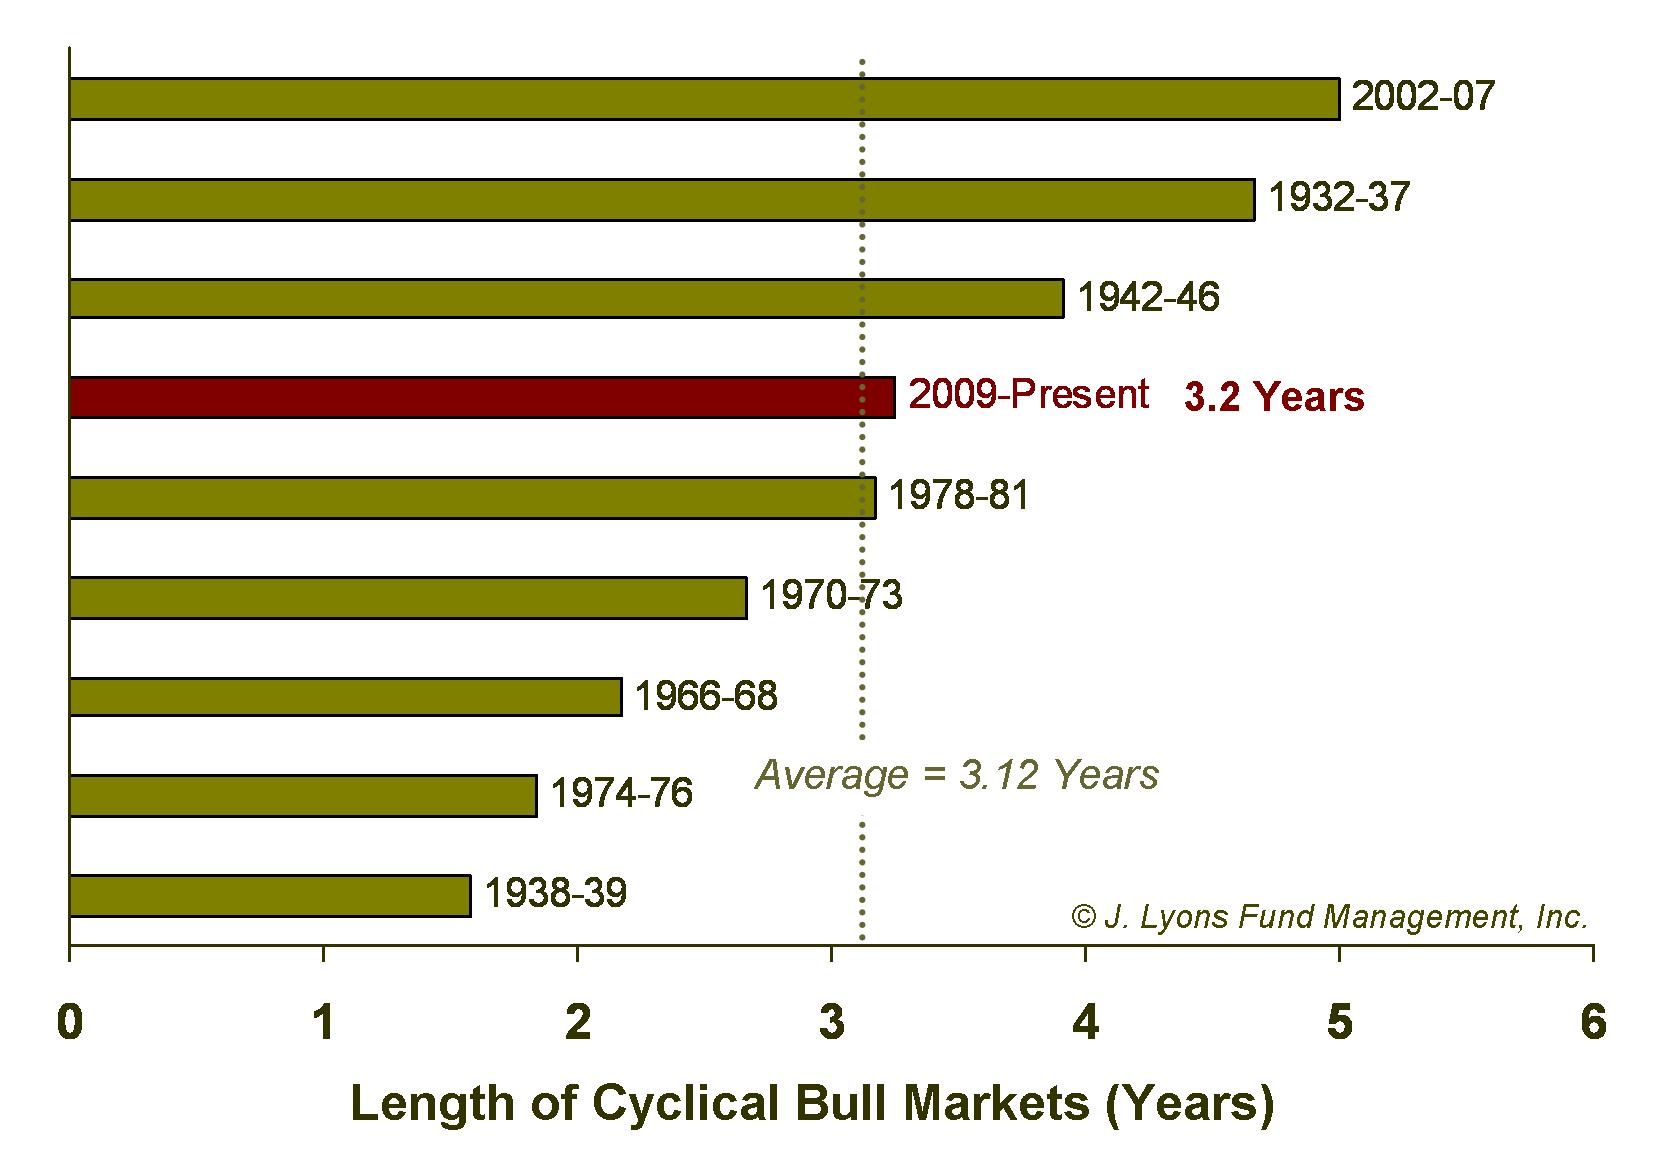
Cyclical Bull Market Durations
The magnitude of a cyclical bull market's return is largely a function of the magnitude of the prior cyclical bear market (think Newton's third law of physics: for every action, there is an equal and opposite reaction.) Therefore, some of the cyclical bull returns, like the 1932-37 rally, benefit from the market having been discounted to a greater extent. Put another way, the market got hammered to such a low level that it was easier for the subsequent rally to garner a greater return, in percentage terms. Therefore, a more apples-to-apples (or liters-to-liters) comparison may be to use duration (i.e., how long do the rallies last?) instead of return.
As with return, the current cyclical bull market looks extended from a duration perspective as well. Beginning in March 2009, the bull is now over three years old, and slightly over the average for the past 80 years of 3.12 years.
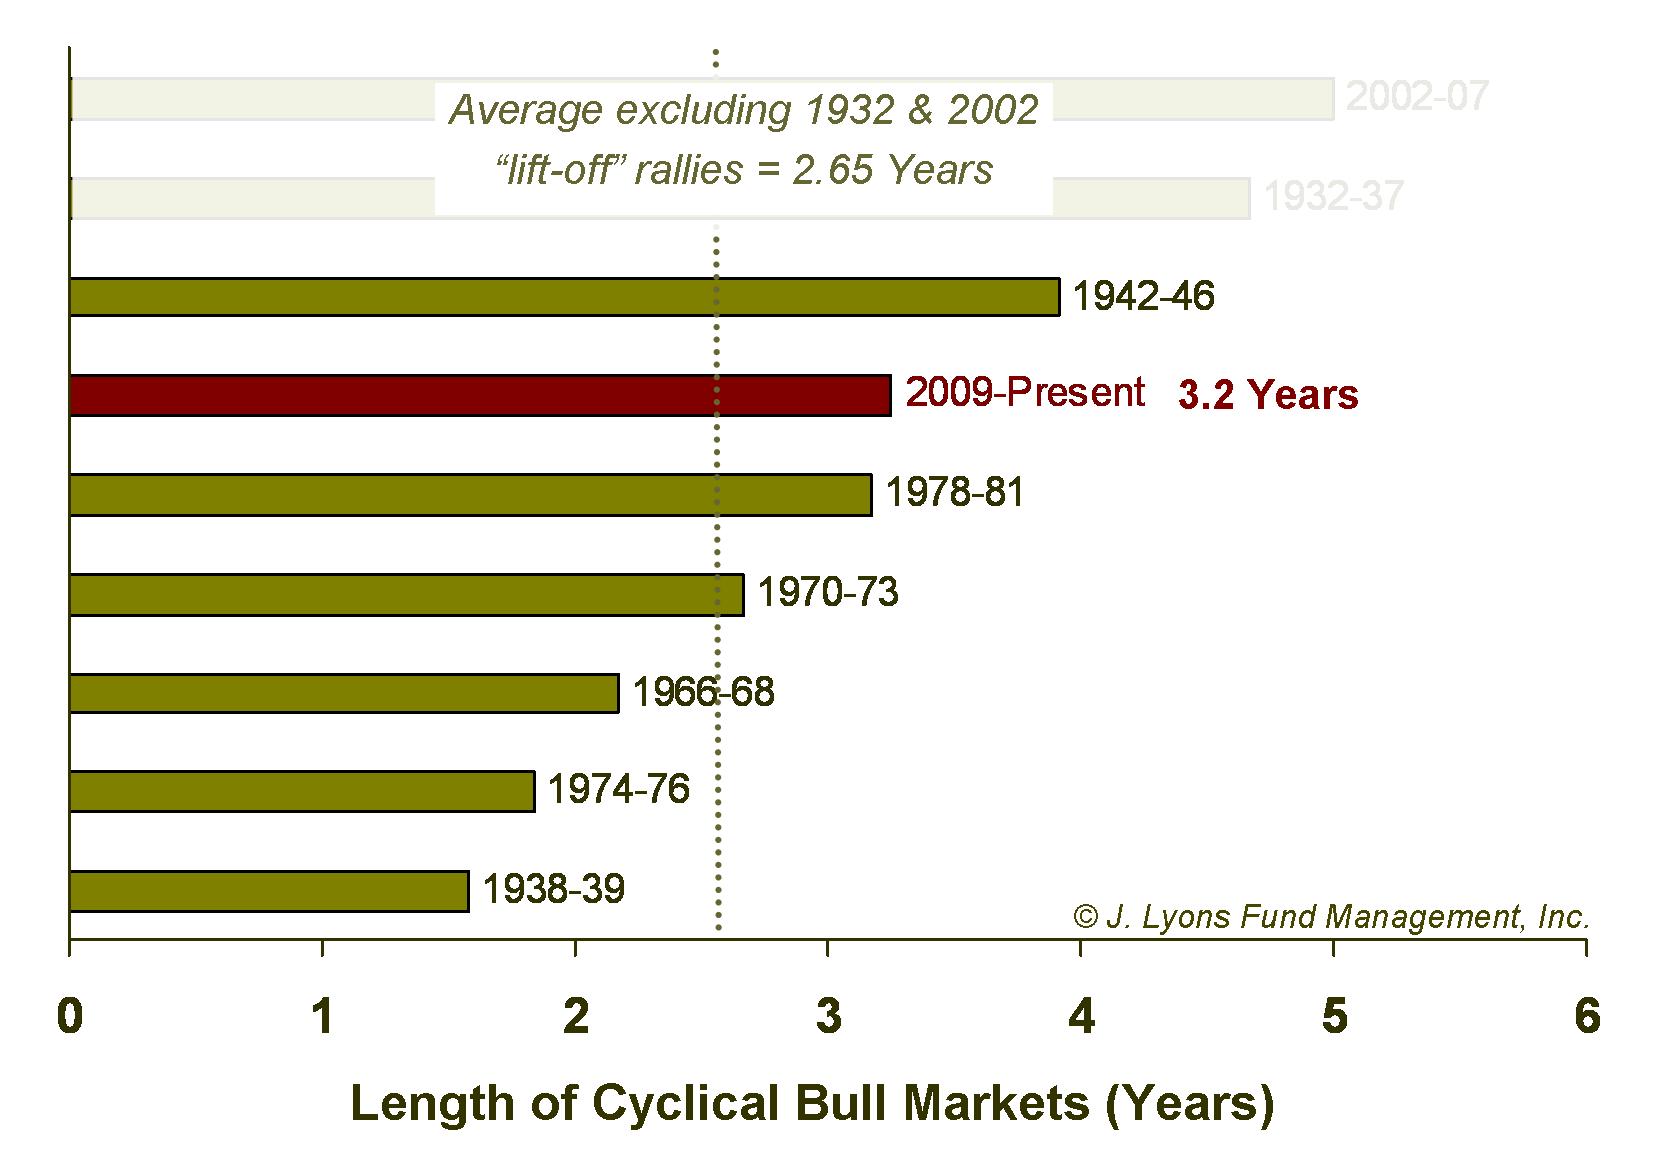
Furthermore, as seen in the return figures, the average
duration is skewed by the cyclical bull markets that began in
1932
and 2002. Why should we view those bull markets differently? We refer
to Newton's law again. Those were the initial, or lift-off, bull
markets during their respective secular bear markets and came on the
heels of tremendous bear markets following the bubble bursts of 1929
and 2000. Therefore, they can be expected to generate a stronger upward
reaction to
the previous devastating bearish action.
And while the bear market from 2007-09 was also devastating, it was
shorter and did not include the bubble-bursting action of the post-1929
and 2000 declines.
If we exclude the 1932 and 2002 "lift-off" cyclical bulls, the current bull appears even longer in the tooth.
Thus, from both a return and a duration perspective, the cyclical/medium-term appears laden with risk here. Of course there are no rules, i.e., the current cyclical bull market will last until it doesn't. However, based on historical precedent, further gains from here would be gravy.
Intermediate/Short-Term
The third star in the market's bearish "constellation" is the short-term, or what we call "intermediate". Yes, the word intermediate implies medium, but the medium-term time frame is referred to as cyclical. Therefore, the intermediate-term is the short-term. Got that?
In market parlance, the intermediate-term is most often identified with market moves lasting on the order of months. As noted in the sidebar earlier, our Risk Model is designed to most closely track this duration since, in our opinion, it is the shortest time frame that still produces market moves significant enough to attempt to profit from (rallies) or avoid (declines). Such moves generally range from 10% to 30%. And just as "secular" markets are made up of smaller "cyclical" moves, cyclical markets are made up of these smaller intermediate-term moves. The rally from the October 2011 low into May is an example of an intermediate-term move.
Since 1929, we have identified 47 intermediate-term rallies occurring within secular bear markets. On average, they lasted 6 months and gained 33%. The current intermediate-term rally is very close to those averages already.
| Gain | Duration | |
| Average Rally (Dow Jones - 1929-2012) | 33% | 6 months |
| Current Rally (Dow Jones) | 28% | 7 months |
While those are the average metrics, the makeup of the individual intermediate-term rallies vary considerably. For example, during cyclical bull phases of secular bear markets, the intermediate-term rallies last longer (around 9 months), on average, than they do during cyclical bears. As we discussed above, we are currently in a cyclical bull (albeit an aging one) so that condition would allow for perhaps a further extension to this rally.
Speaking of aging bull markets, another varying factor among intermediate-term rallies is their location within a cyclical bull market. As we discussed regarding cyclical bull markets, the initial (or "lift-off") intermediate-term rallies that begin cyclical bulls are often the most powerful. As the cyclical bull ages, the intermediate-term rallies begin to fade in intensity.
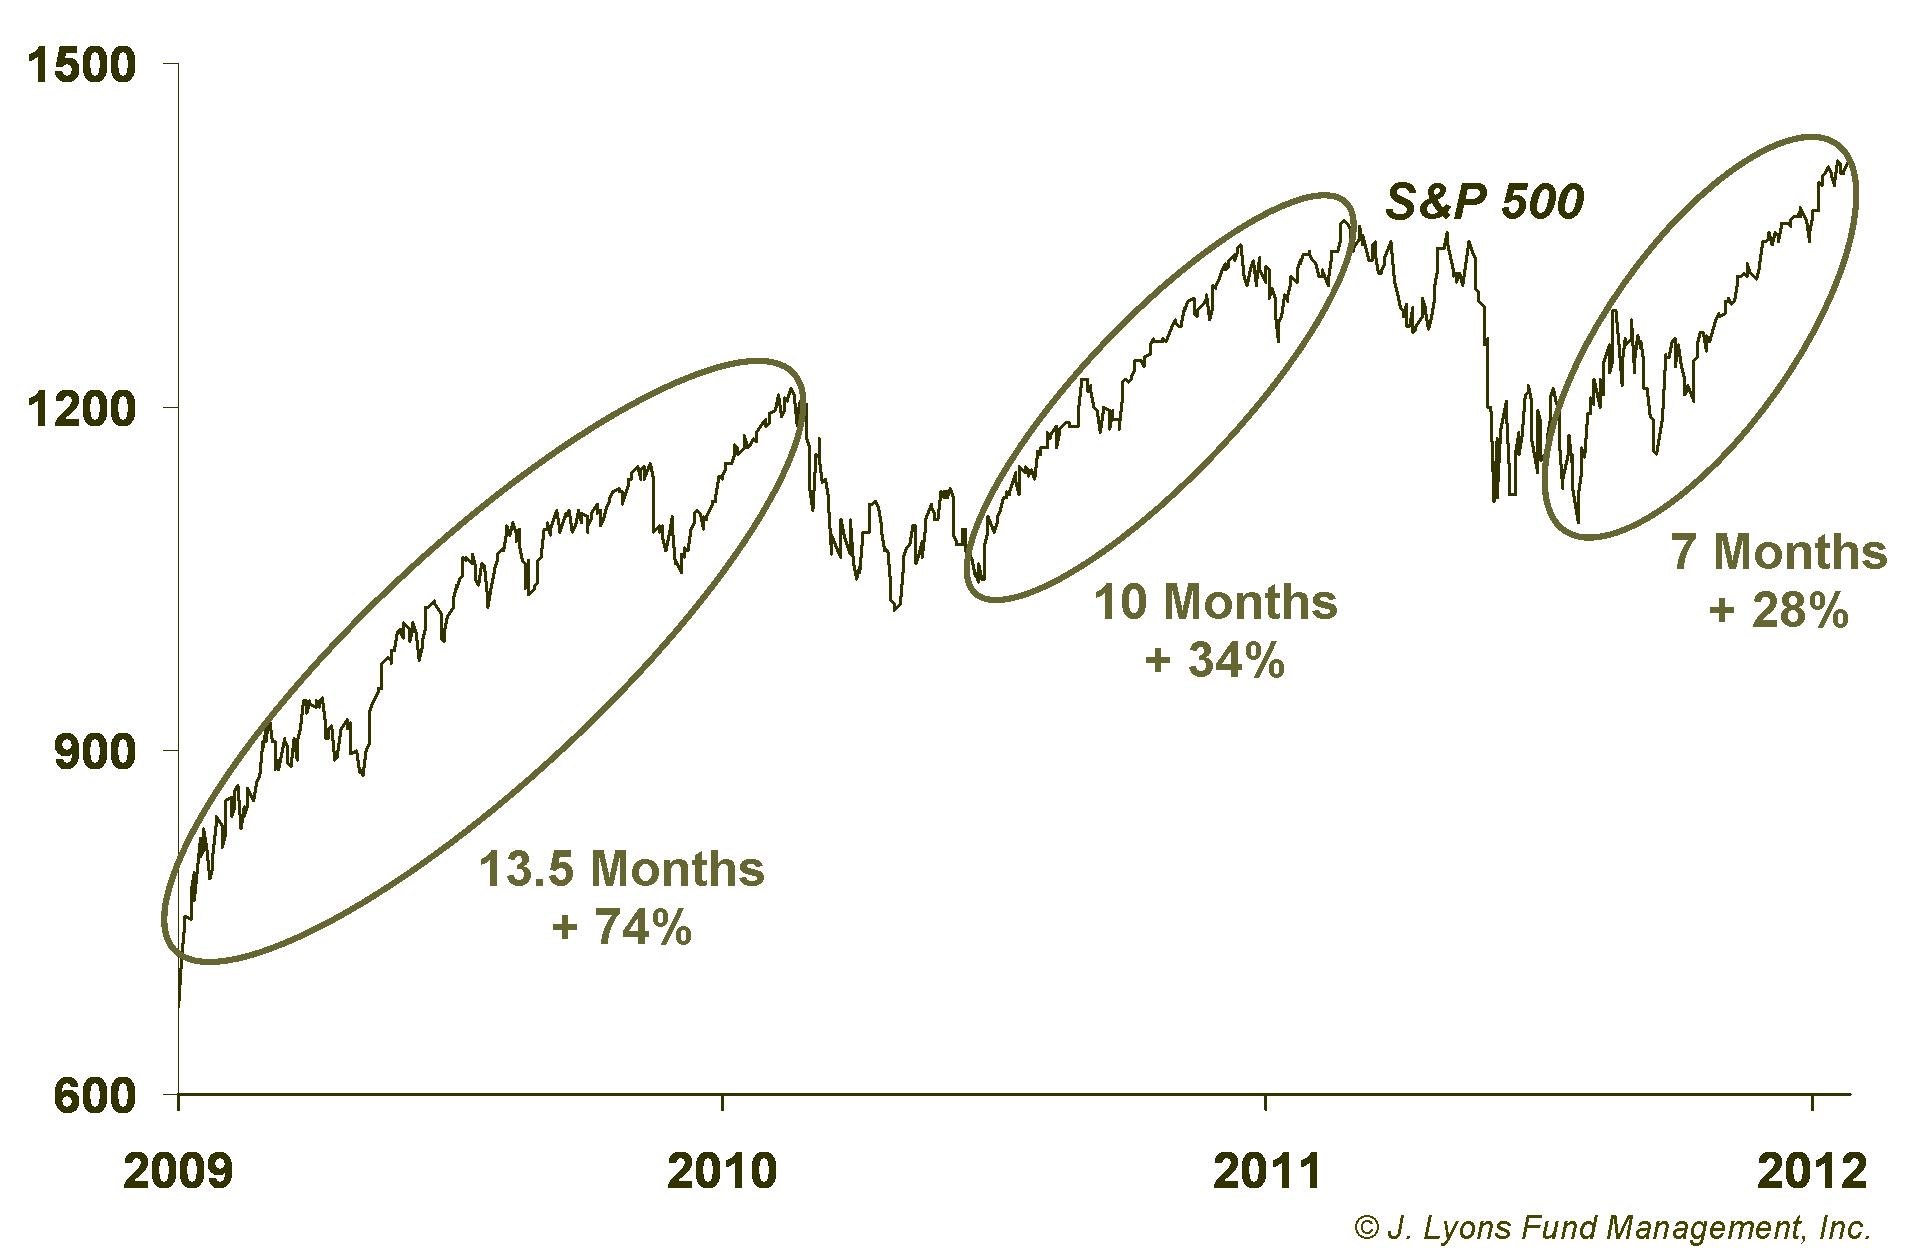
For example, the initial
intermediate-term rally in this cyclical bull that began in March 2009
arguably lasted over a year and gained some 74%. The next rally that
began in September 2010 was considerably weaker than that initial one.
We can thus expect that the current rally will quite likely be weaker
than that. Therefore while this intermediate-term rally may have a
bit more
left in its tank, the low-fuel warning light is probably
flashing.
Conclusion
Investment Principle
Our analysis of the multi-duration risks here is based on historical market patterns and behavior. Investors who are used to hearing the "conventional" investment blather may wonder why we use historical data to analyze current markets. Shouldn't we be parsing the press releases out of Europe, handicapping U.S. political scenarios and combing through earnings reports?
The fact is, but for a nano-second, most of that is meaningless "noise" if you understand how the market discounts and filters all of it. This noise may offer compelling topics for discussion -- after all, how many stock-related TV channels are there now? However, attempting to manage investments based on the never-ending, constantly-changing news flow would make one's head spin (though, you would be shocked to learn how much investor [yours?] money is managed by winging it like that.)
While the news flow is always changing, there is one factor in the market that does not change throughout time: human nature. That is why we study history and cycles. Because we know that humans will respond to stimuli in a predictable manner, market cycles will always repeat. Greed will result in up cycles and fear will bring about down cycles. When one of those emotions reaches an extreme, we get a change in trend. We believe we are on the cusp of a trend change now, from a greed-induced uptrend to a fear-laden downtrend.
Market Analysis
Typically, risk levels in the market vary based on the duration that you are considering, i.e., short-term, long-term, etc. However, after analyzing long, medium and short-term market conditions, we have laid out the case that each of those durations is indicating an elevated level of risk.
The secular (long-term) bear market that began in 2000 is firmly intact and likely to persist for the better part of this decade. Stocks are currently much closer to the top of the secular bear range and have diverged upward somewhat from previous secular bear behavior. These conditions suggest that the potential risk far outpaces current potential reward. In addition, the cyclical (medium-term) and intermediate (short-term) rallies are extended to where they at least reach, and by more measurements, exceed historical norms. This bearish "triple threat" represents the most dangerous of markets for investors.
Market tops are often drawn-out processes so there certainly may be more short-term rallies before the end-game. However, we are now in the equivalent of soccer "penalty time". The "normal" game clock has run out and any further gains from here is just a bonus. This bonus time, however, can run out at any moment. Therefore, any such bonus rallies may simply offer the opportunity to reduce equity exposure, or "get out" at a better price. Don't be sucked into the excessive optimism that accompanies market tops.
How bad might a forthcoming decline be? We will cover that next time but for now understand that the last few instances in which the three time frames were aligned this bearishly were the summers of 2000 and 2007. If your investment approach is the same as it was during those times, please take action now to find risk-managed assistance with your investments. When the bearish risk finally manifests itself, to continue the theme of threes, it will be strike three for many investors.
Update: The bearish stars shone brightly (or darkly?) on the markets in May with the perceived risk manifesting itself in serious market weakness. The intermediate-term rally that we said was probably running out of gas is most likely on empty. For investors (like JLFMI's clients and subscribers to our 401(k) investment service, My401kPro.com) who were able to avoid, or at least mitigate some of the damage of the past month, the good news is that much of the intermediate-term risk has now been removed. For investors that took heavy losses, obviously that is little solace. However, the damage was significant enough to push investor sentiment to extreme levels of bearishness (for the short-term). Therefore, there is potential for the stock market to stage a rally over the next 1-3 months, perhaps. Should that transpire, we reiterate our warning from above to use that strength to reduce investment risk.
Dana Lyons
Vice President
The
commentary
included in this newsletter is provided for informational purposes
only. It does not constitute a recommendation to invest in any
specific investment product or service. Proper due diligence should be
performed before
investing in any investment vehicle. There is a risk of loss involved
in
all investments.