| June 2014 | Posted June 19, 2014 |
Cracks In Market Chemistry
While the S&P 500 is scoring new highs, weakness in high-beta areas threatens the stability of the rally
"Talent wins games, but teamwork
wins championships.”
- Michael Jordan
In October 1995, the Chicago Bulls acquired Dennis Rodman in what, at the time, was considered a gamble of a trade. Back then, the Bulls were lacking in one area, rebounding, and Rodman was unquestionably the best rebounder in the game. However, he was also the most enigmatic and controversial player in the league and was coming off a season with the San Antonio Spurs in which his behavior single-handedly destroyed the team chemistry and derailed their season. So Rodman’s signing was a high risk-high reward proposition. His talent was a perfect match for the Bulls – if they could just harness his ticking time bomb personality.
To make a long story short, the Bulls would set an NBA record for most wins that very next season, winning their first of three straight championships from 1996-98. Rodman would lead the league in rebounding all three seasons and, thanks in part to the overlord presence of Michael Jordan, for the most part kept his behavior in check (minus an incident involving his foot and a cameraman’s groin). After the 1998 season, Jordan retired and the Bulls team disbanded. Rodman signed with the Lakers, who were not so fortunate with the experiment. After winning 61 games and making it to the conference finals the year before, the Lakers sputtered in 1999, eventually getting swept in the semifinals. Much of their performance drop was attributed to issues pertaining to Rodman’s signing. He missed several practices and games, one during which he was spotted gambling in Vegas, and created a constant distraction off the court with antics, including his public divorce of Carmen Electra (he would eventually go on to marry himself). Although he played in just 23 games before the Lakers decided to let him go, the damage to the team’s chemistry was done.
So what in the wide, wide world of sports does Dennis Rodman have to do with this market? I like to think of players like him as akin to high-beta, high risk/high reward types of stocks. They have the potential to juice the market, up or down. When volatility is low and these stocks are moving up, all is good with the market “chemistry”. In this case, they can supercharge a rally. However, when these stocks start to break down and exhibit increased volatility, their elevated beta can disrupt that chemistry and lead to increased downside risk.
Despite
the current all-time highs in the major averages, there have been
numerous signs of a cracking in the market’s chemistry due to the
action in these high-beta stocks. We have a barrage of charts
demonstrating this cracking, which could be a warning sign for the
broader market.
Disclaimer: While this study is a useful exercise, JLFMI's actual investment decisions are based on our proprietary models. Therefore, the conclusions based on the study in this newsletter may or may not be consistent with JLFMI's actual investment posture at any given time. Additionally, the commentary here should not be taken as a recommendation to invest in any specific securities or according to any specific methodologies.
The Dennis Rodmans of the Stock Market
So which stocks are the volatile, high risk/high reward Dennis Rodmans of the market? We're focusing on three such groups. Two of them, small caps and Nasdaq stocks, have consistently fit that bill for long enough to allow for behavioral comparisons with previous market cycles. Small caps are the least established, lowest-capitalized stocks and, thus, highly speculative by nature. Nasdaq-listed stocks are in general more speculative than those listed on the NYSE and have historically exhibited higher beta. Lastly, there is always a wild card group (or groups) of high-beta stocks that emerges in each market cycle: the bubble du jour. While perhaps not always a bubble per se, this is a sector or group that exhibits the greatest leadership during a market cycle advance, but also ends up the poster child of the froth of the particular cycle top. Each of these three groups has exhibited behavior recently that threatens the chemistry of the market's advance.
Small Caps
First, note the relative increase in volatility in small cap stocks that has been a precursor to market declines in the past. The ratio of the Russell 2000 Small Cap Volatility Index (RVX) to the S&P 500 Volatility Index (VIX) has recently spiked to the highest levels since 2007. Back then, the ratio remained high for much of 2006-07 before the cyclical decline began. Also, smaller spikes in RVX:VIX in 2011 and 2012 led to smaller market declines.
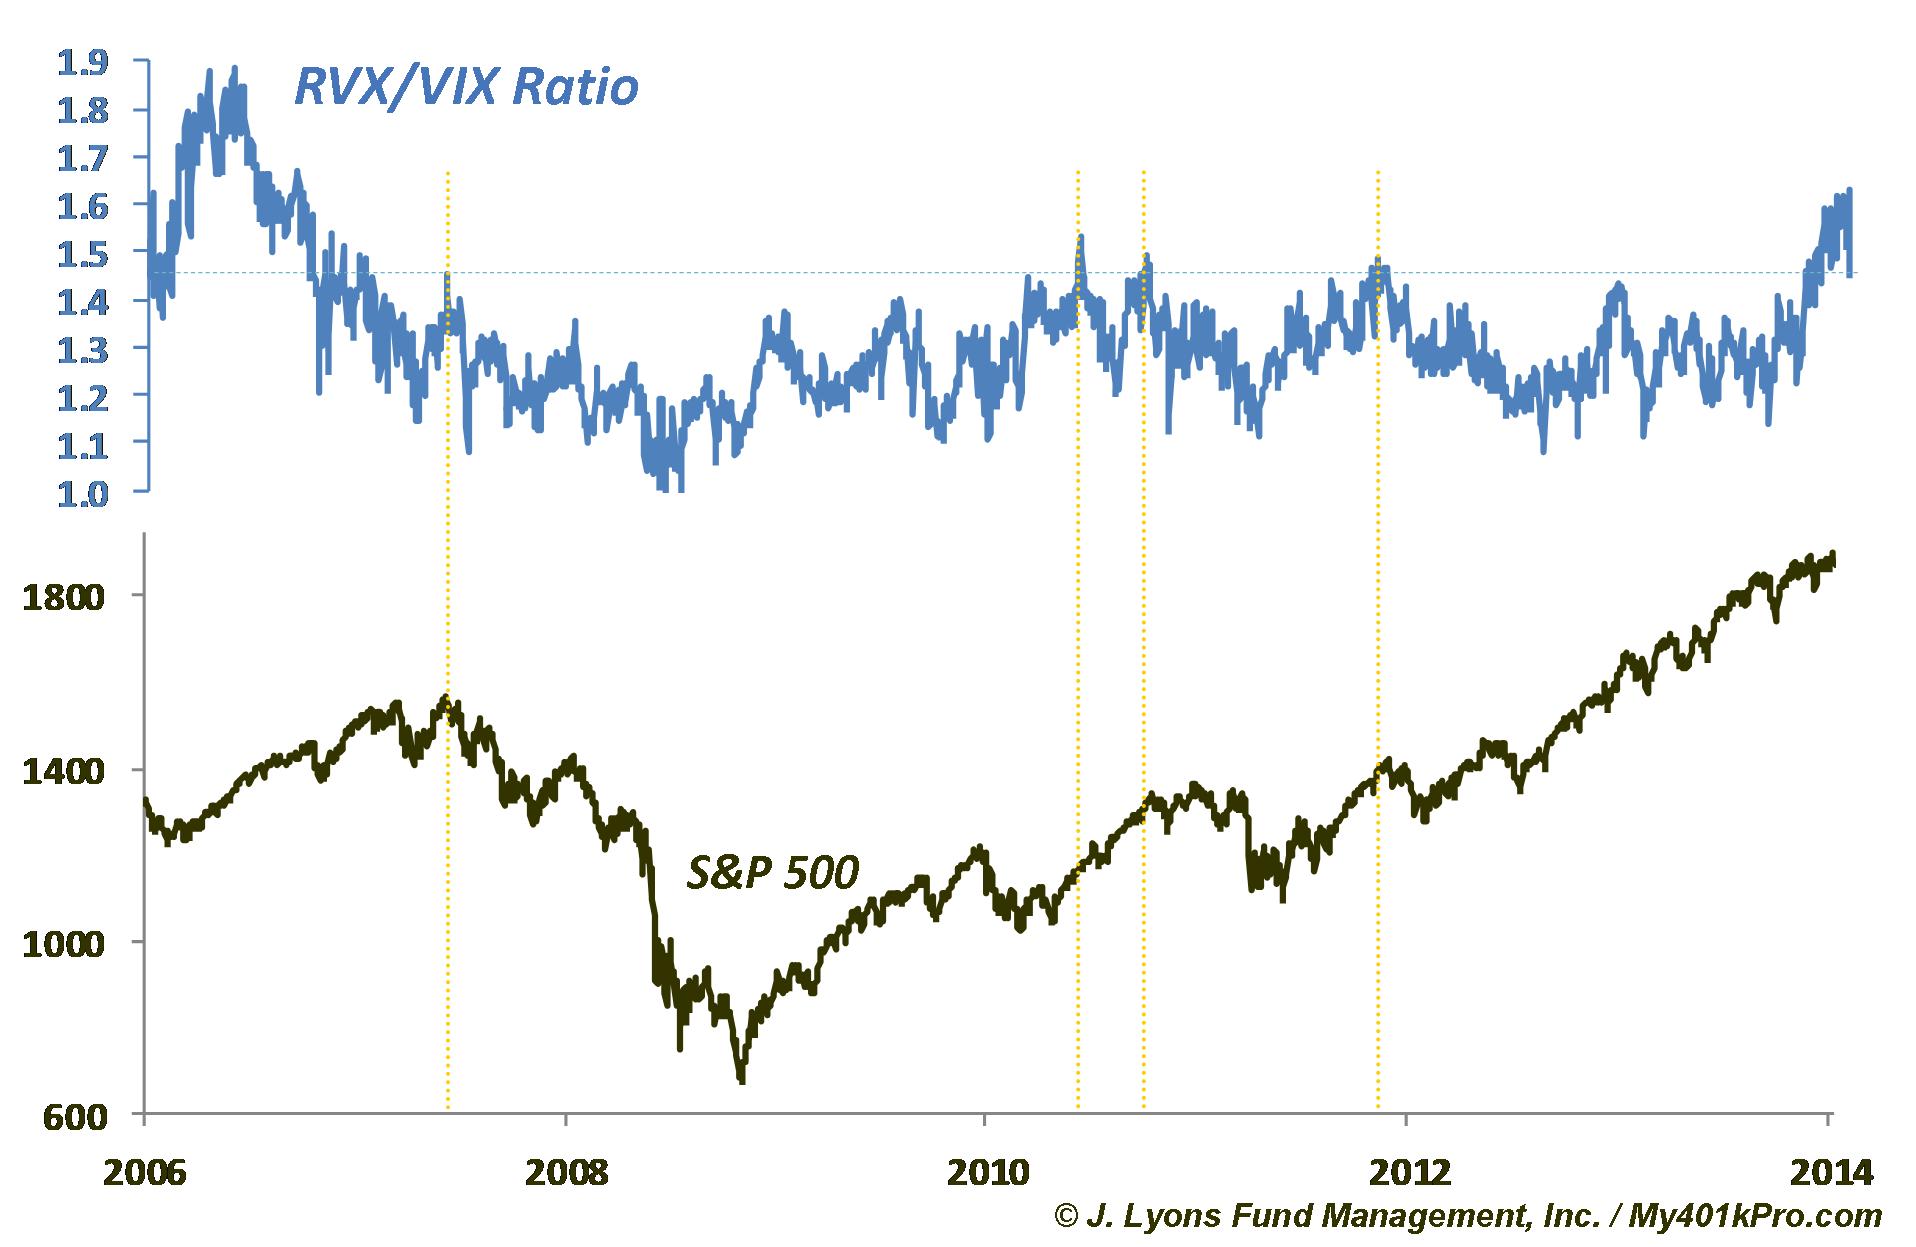
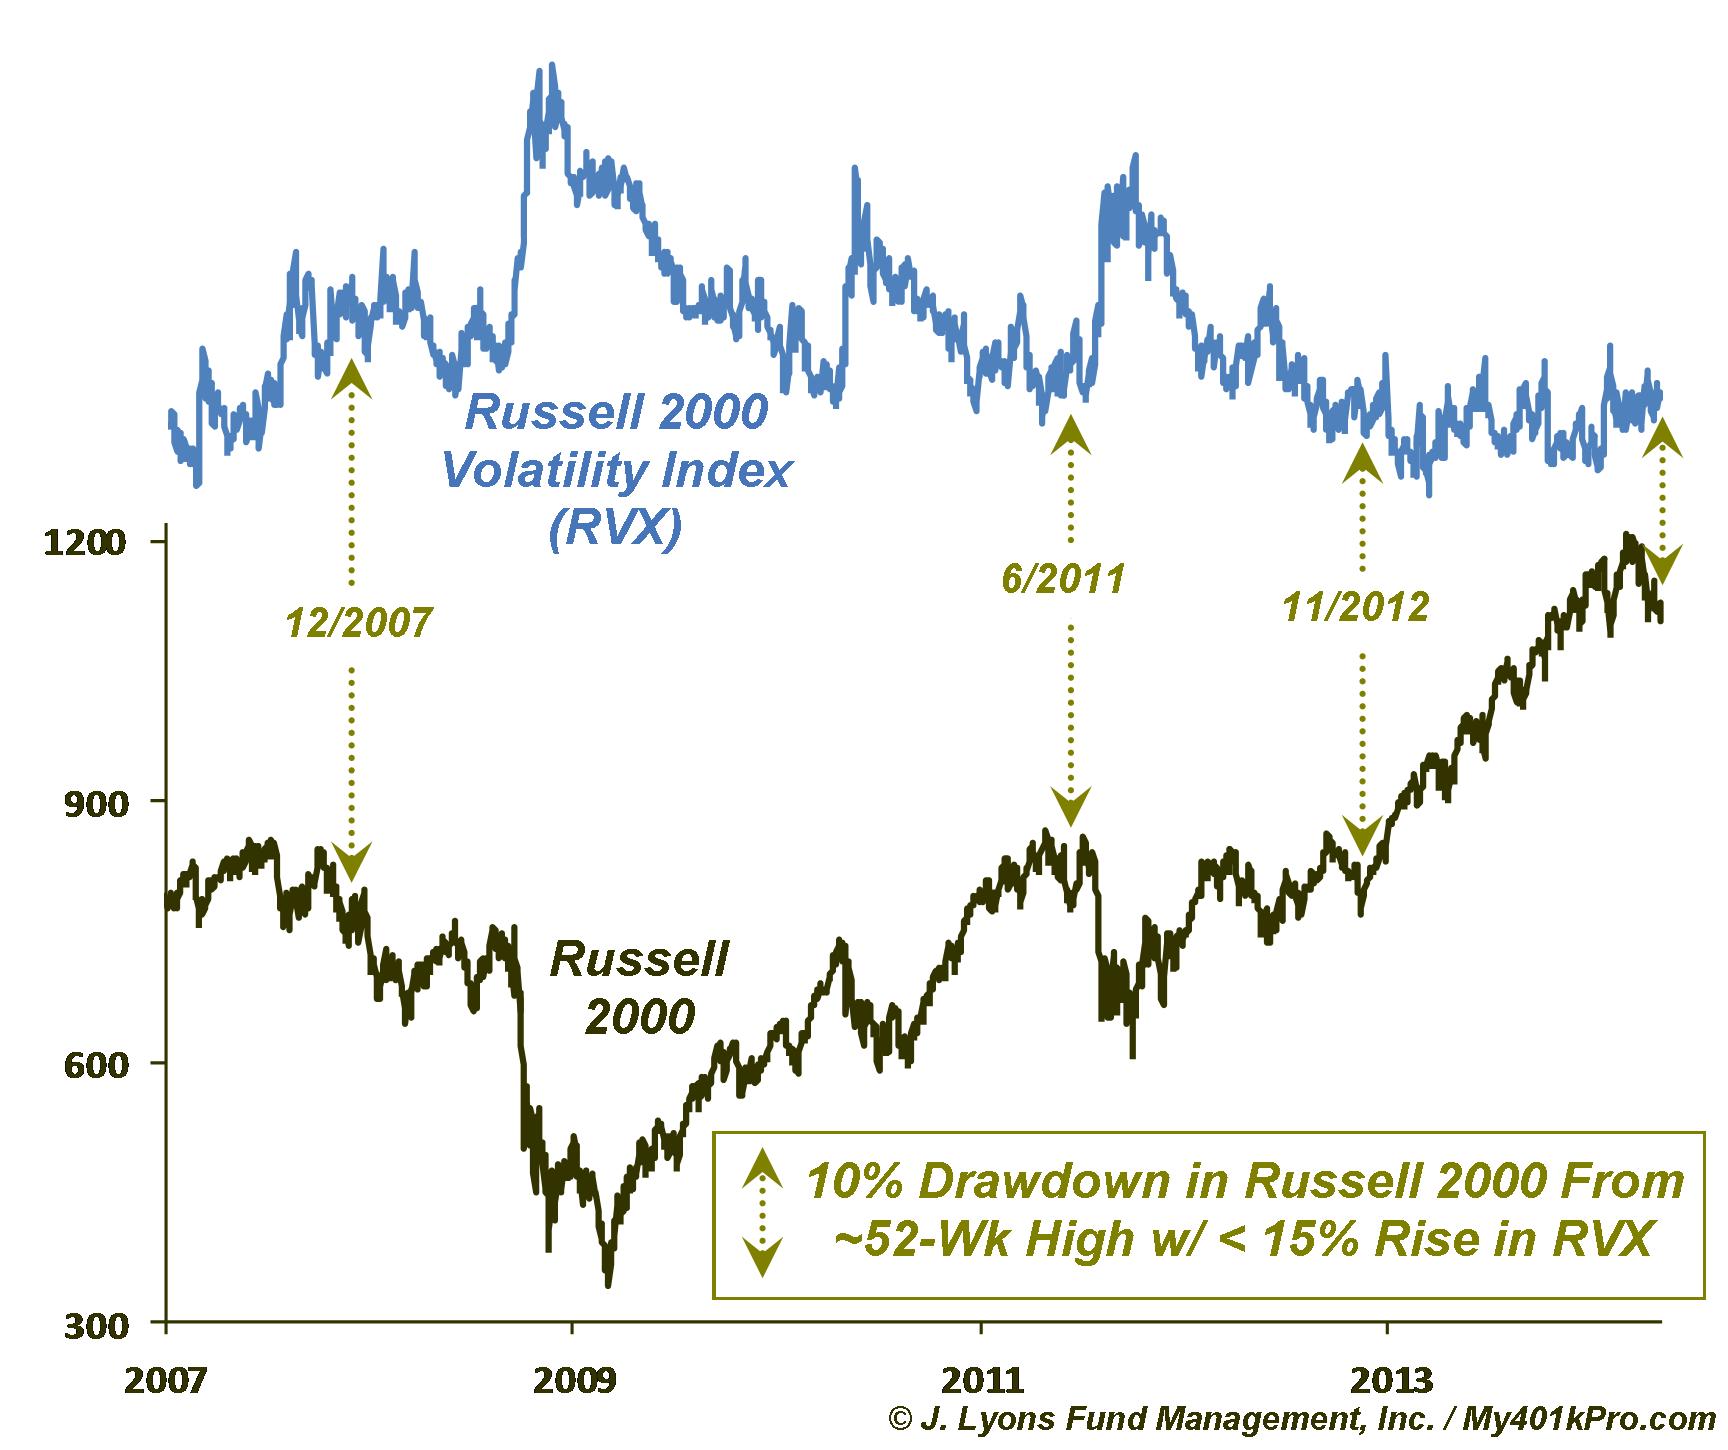
While relative small cap volatility has spiked, on an absolute basis, RVX is still very low, especially given the recent correction in the Russell 2000. Based on past occurrences, this is concerning and suggests the RVX is underestimating potential risk. In 2007 and 2011, the Russell 2000 suffered corrections with a similar subdued response in the RVX. Eventually, this led to larger declines in stocks and big spikes in RVX (2012 was an exception).
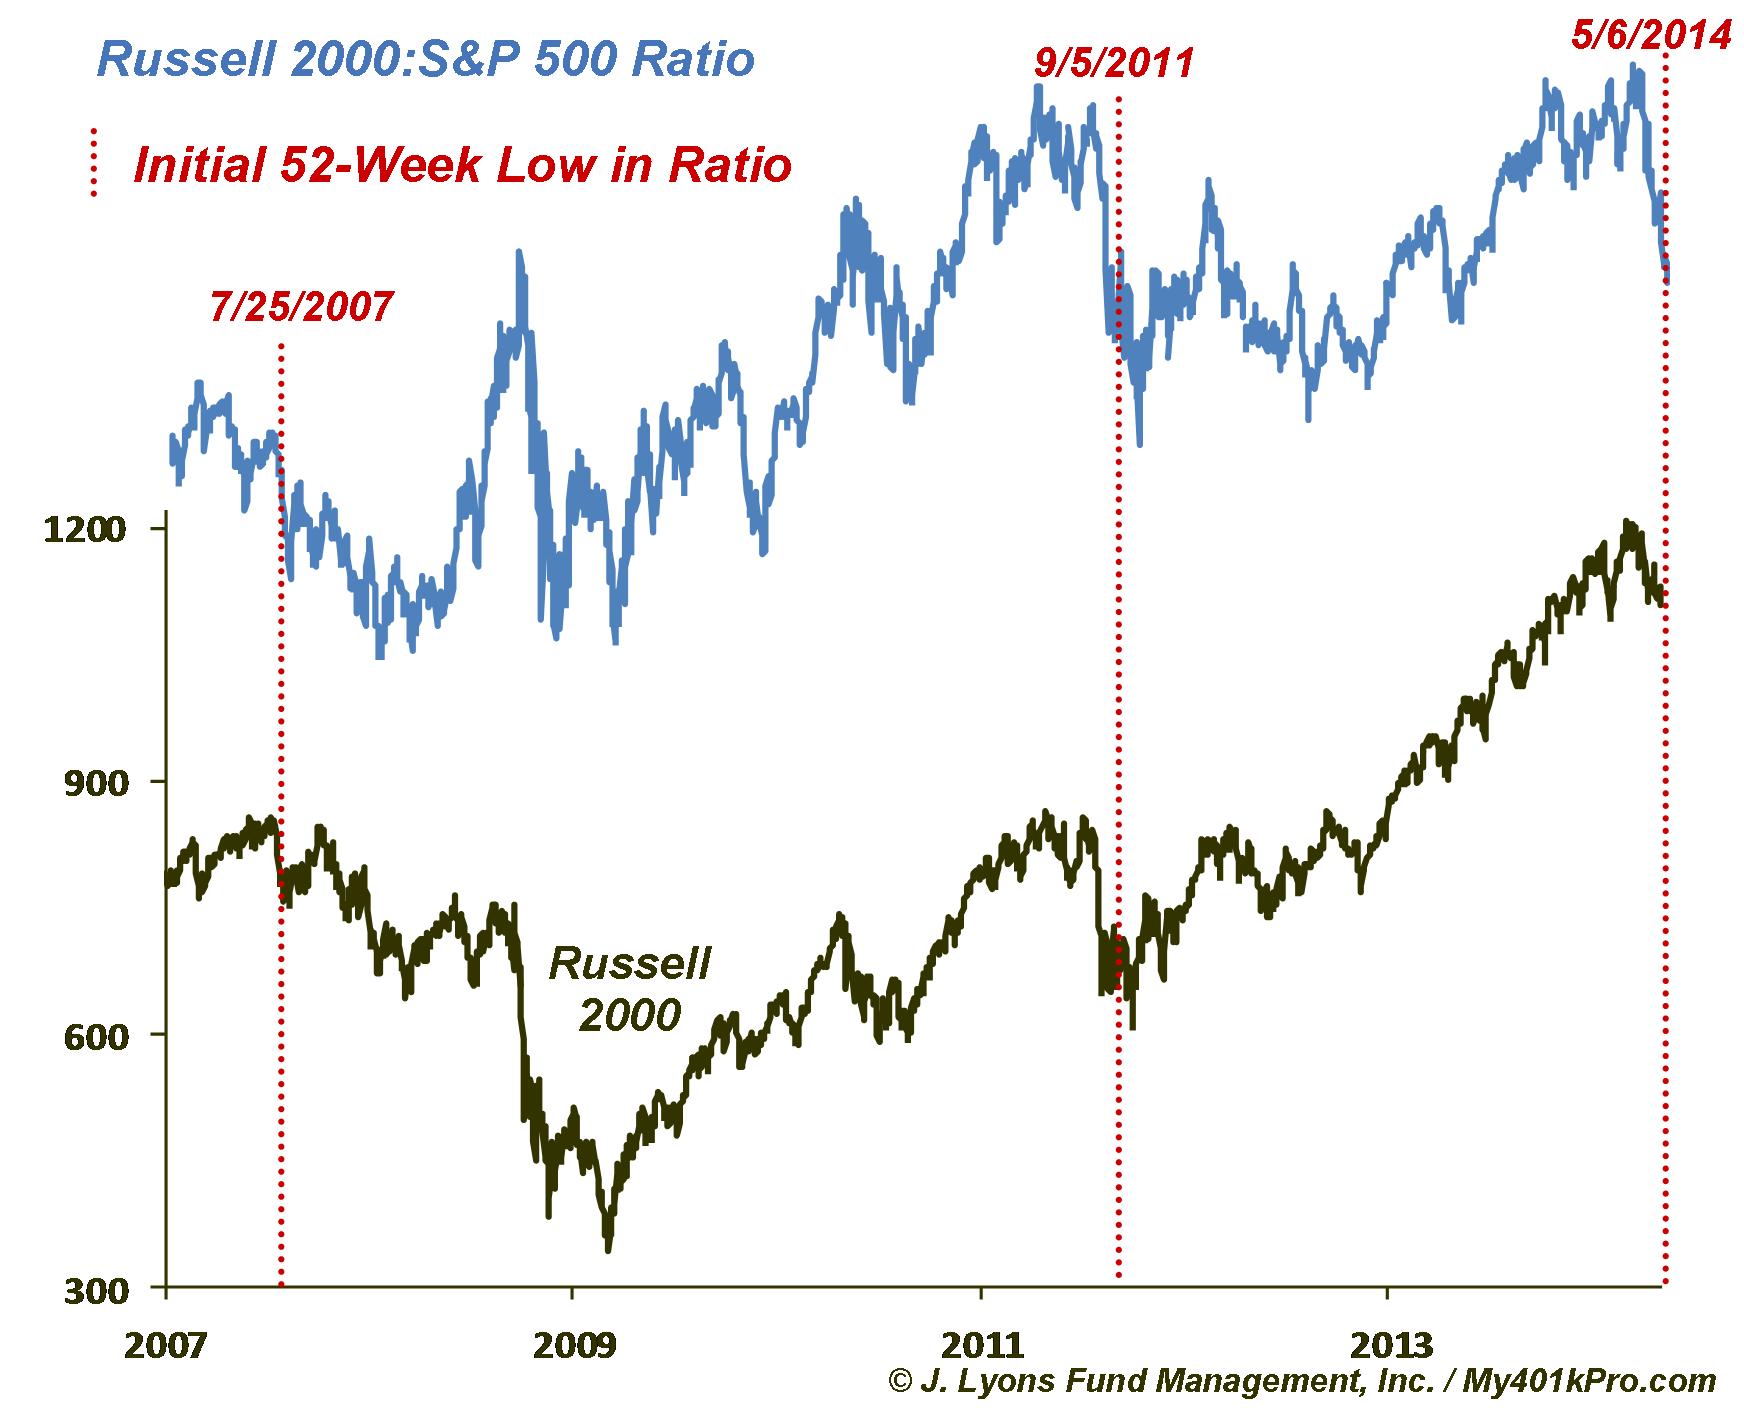
From a price perspective, small cap stocks recently suffered a relative breakdown vs. the rest of the market. The ratio of the Russell 2000 to the S&P 500 actually hit a 52-week low in recent weeks, despite just moderate overall losses. This is only the 3rd 52-week low in the ratio since it was consistently making such lows in 1999 prior to the 2000 top. In 2011, the 52-week low in the ratio came close to the low after most of the damage to stocks had been done. The 2007 occurrence was similar to the current situation as it came during a relatively benign drop in stocks, but forewarned of the larger one that began a few months later. We view this deterioration in small caps as an unhealthy sign for the overall market.
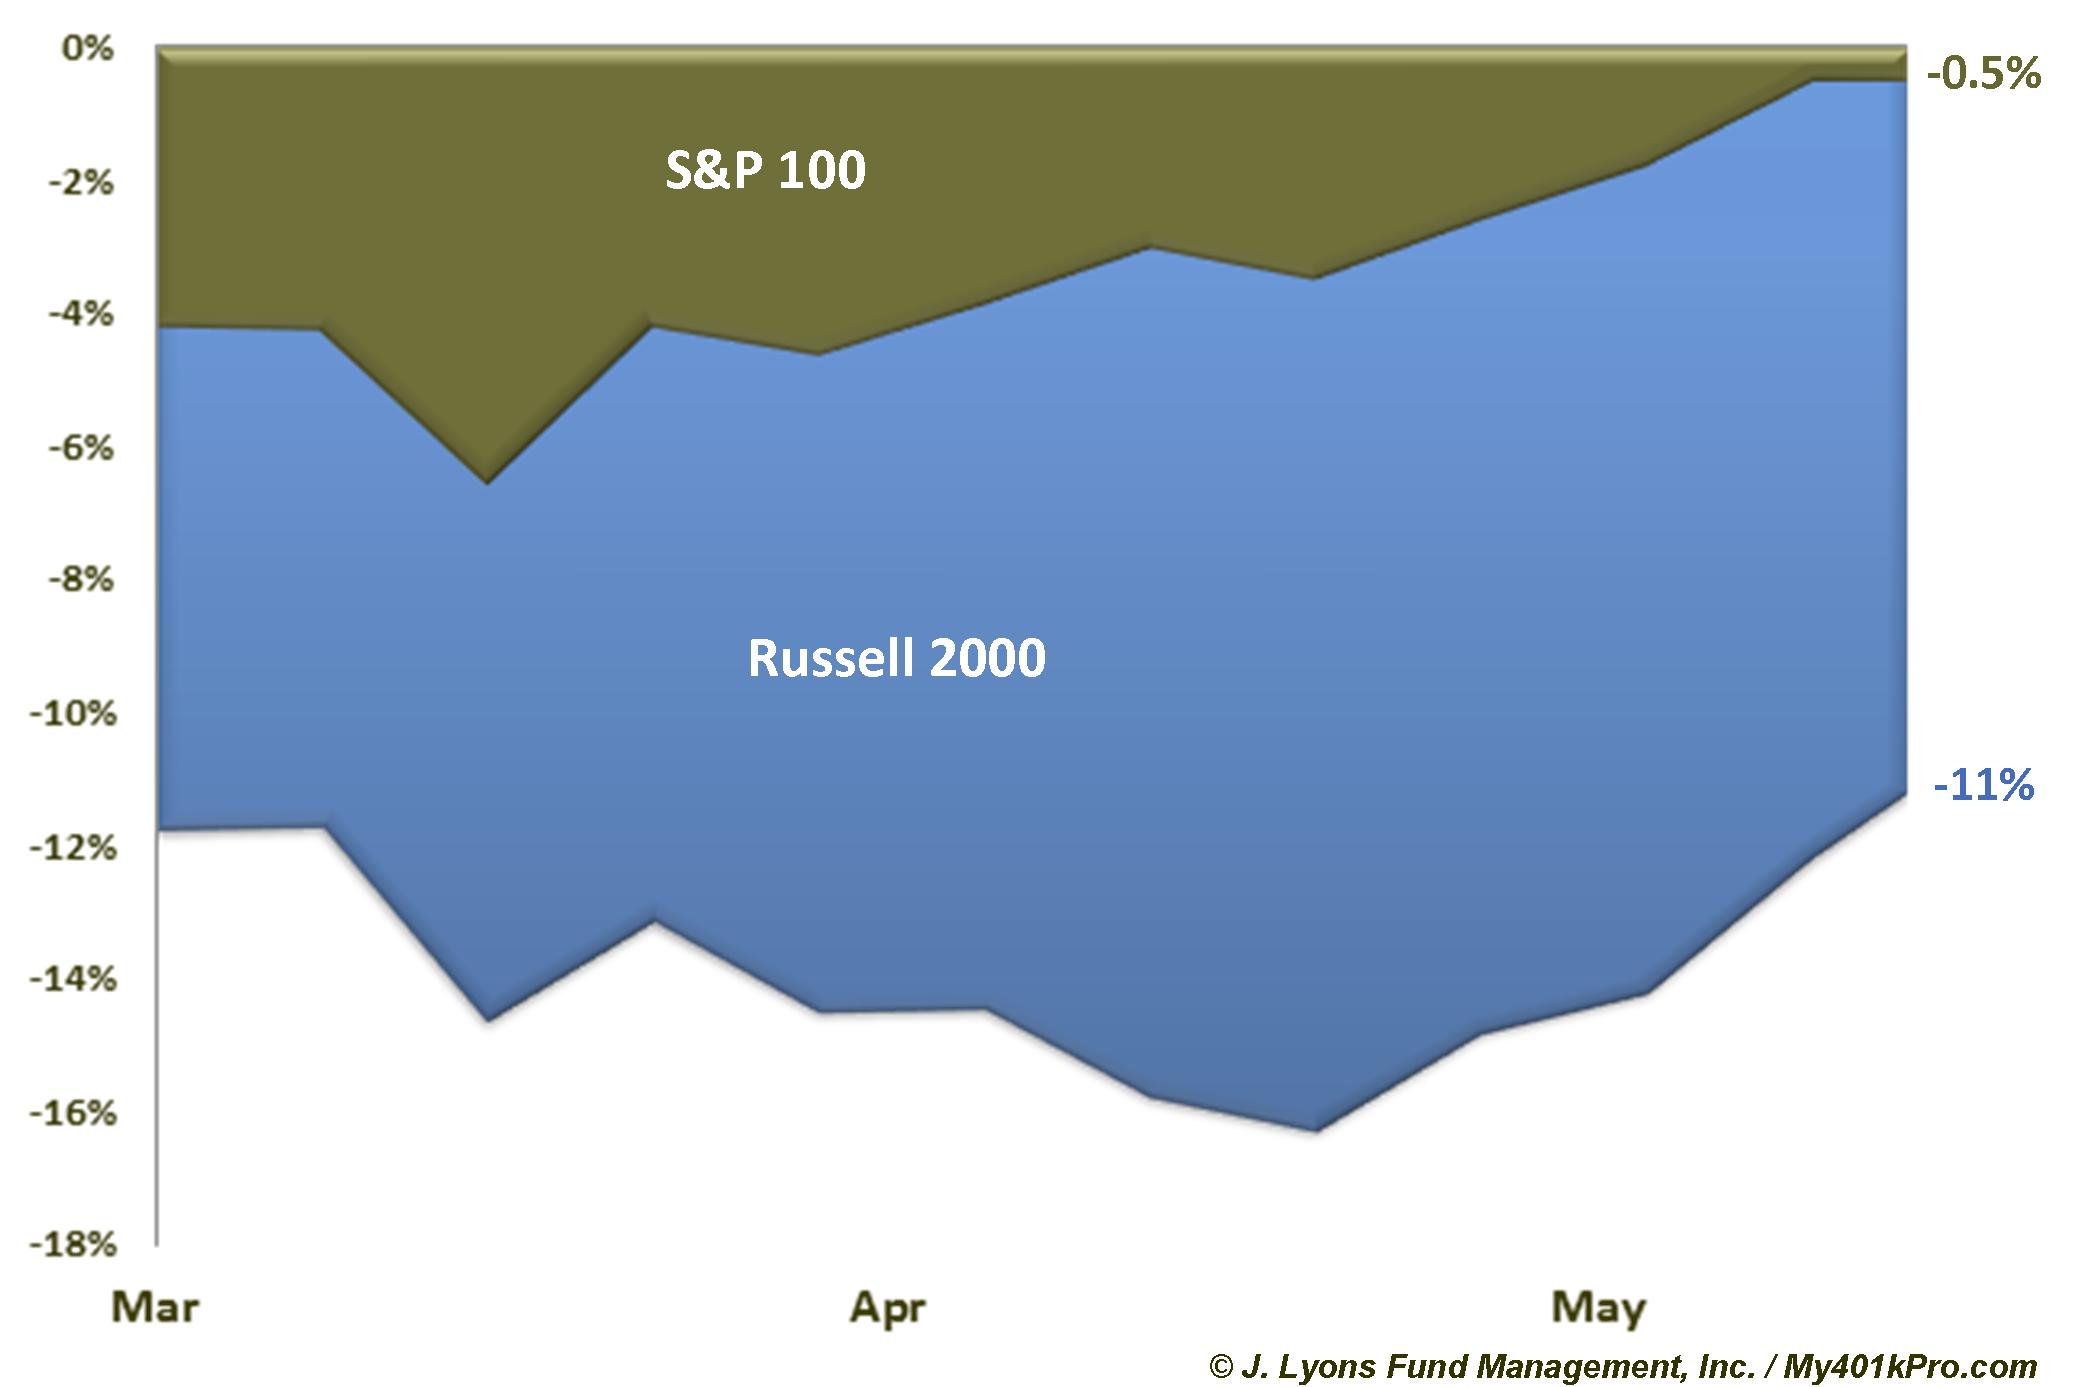
Another way to view the small cap deterioration is by looking at how far the individual stocks are from their 52-week highs. In this chart, we see that, while the median stock in the mega-cap S&P 100 is nearly at a 52-week high, the median Russell 2000 stock is still well off of its high. And this is after roughly an 8% bounce in the Russell 2000 index.
Nasdaq Stocks
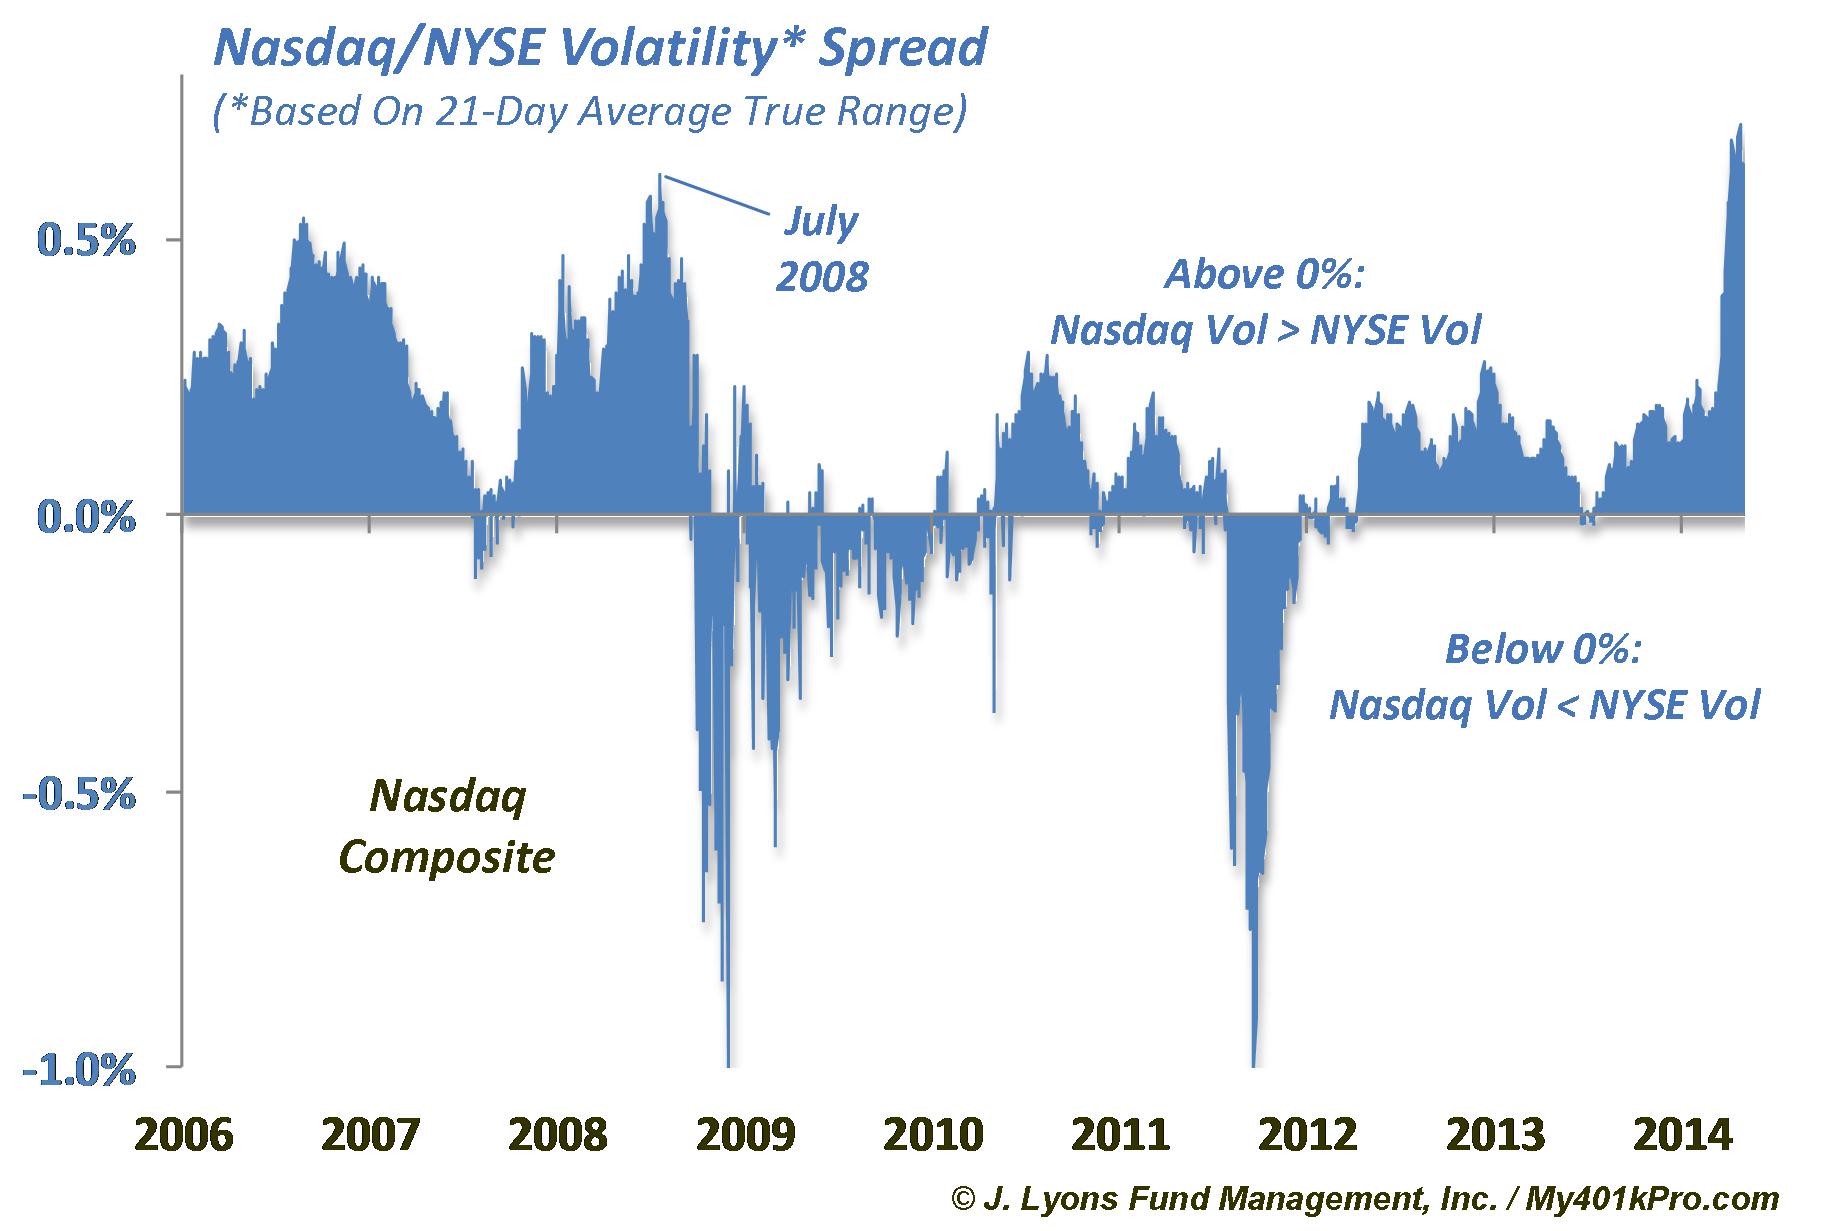
The story is similar with Nasdaq stocks. Though also still low on an absolute basis, relative volatility there has recently become elevated. This has not been a good omen for stocks in the past. As measured by Average True Range, Nasdaq volatility has spiked relative to the NYSE. We saw a similar spike starting in 2007, and eventually peaking in July 2008, which preceded the bear market.
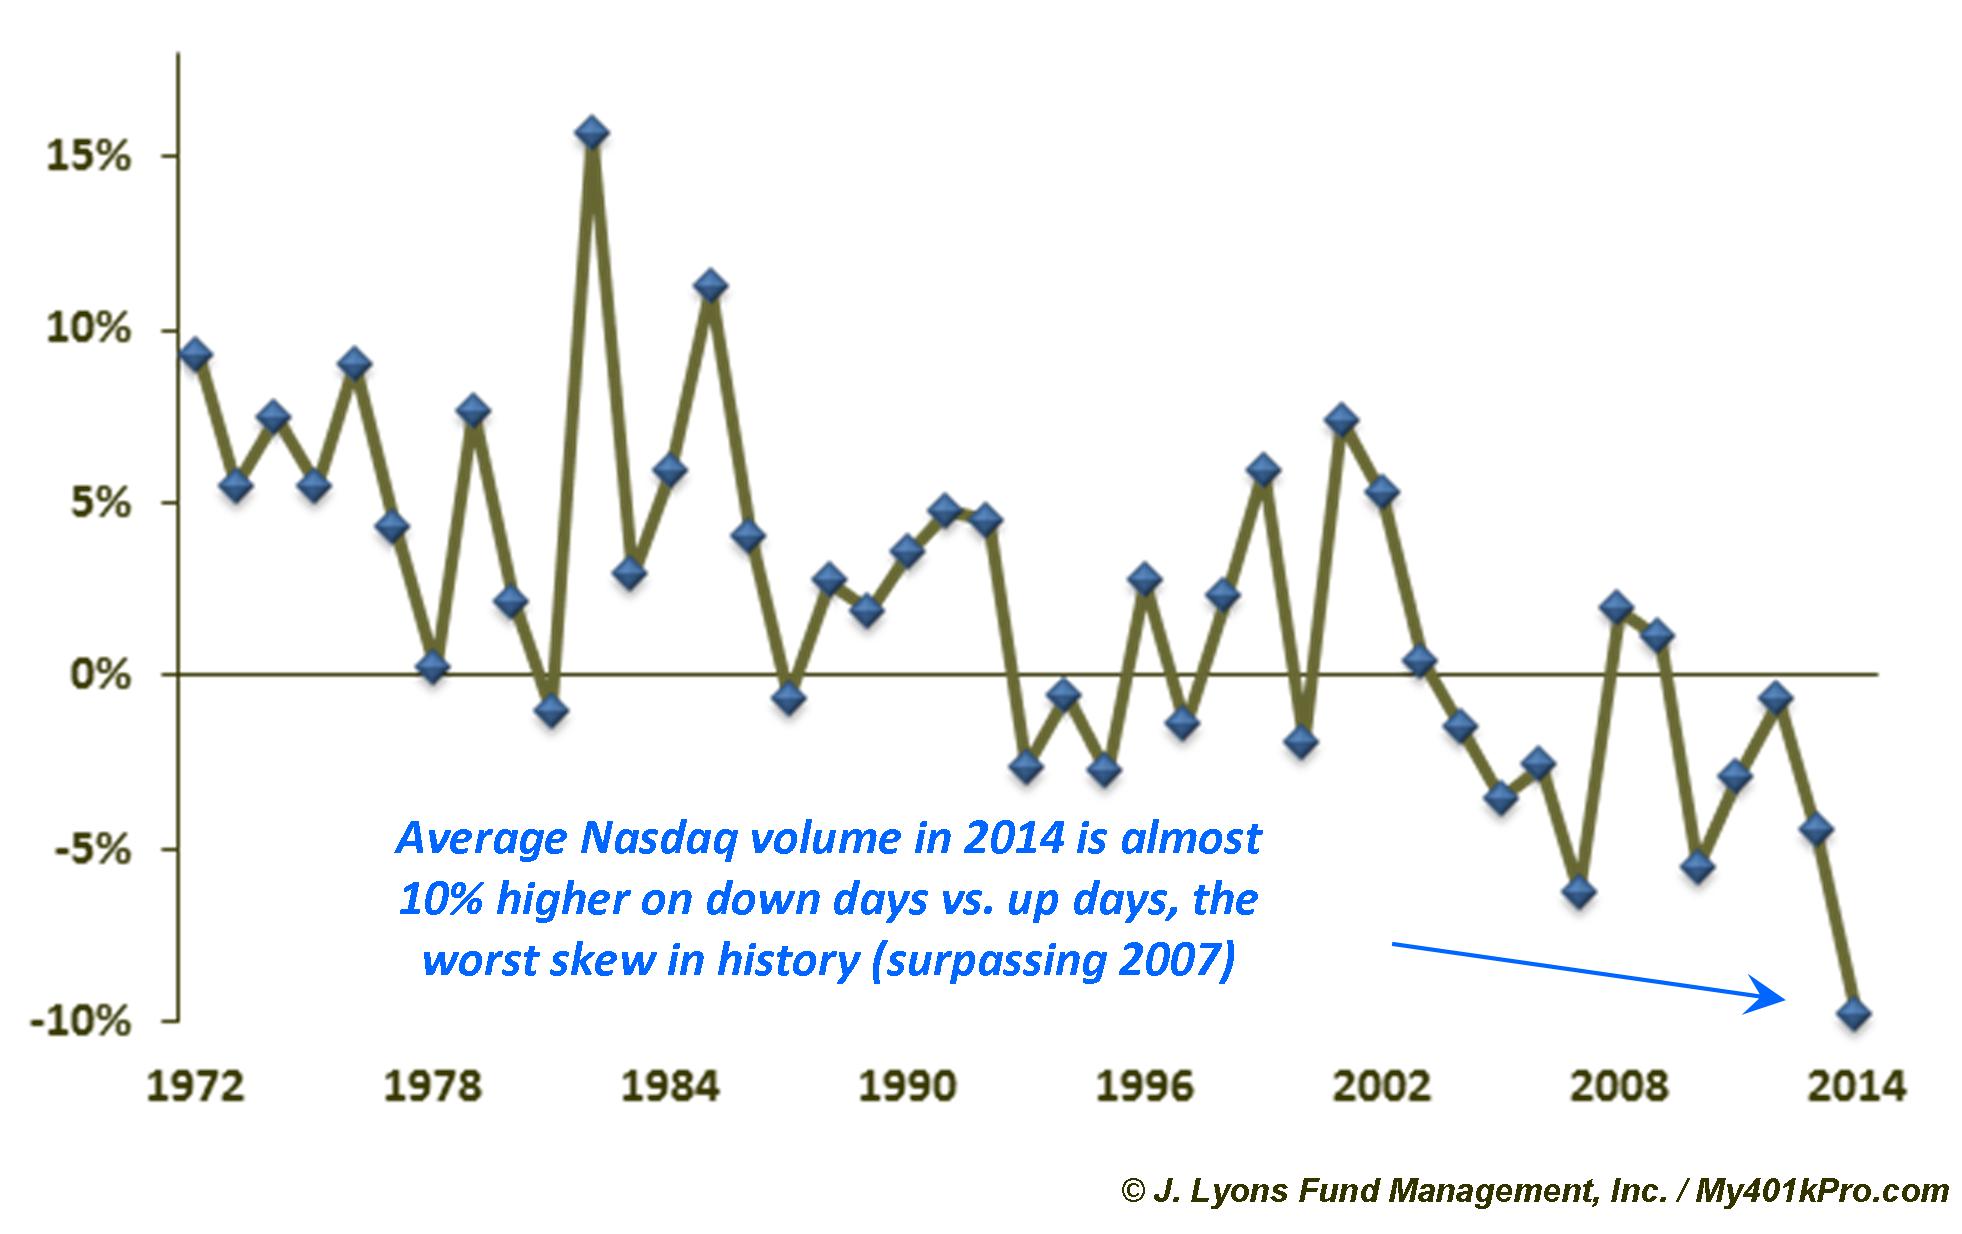
Volume trends on the Nasdaq have also been troubling in recent months. For example, average volume on the Nasdaq on down days has been about 10% higher than on up days thus far in 2014. This is the most skewed of any year in history.
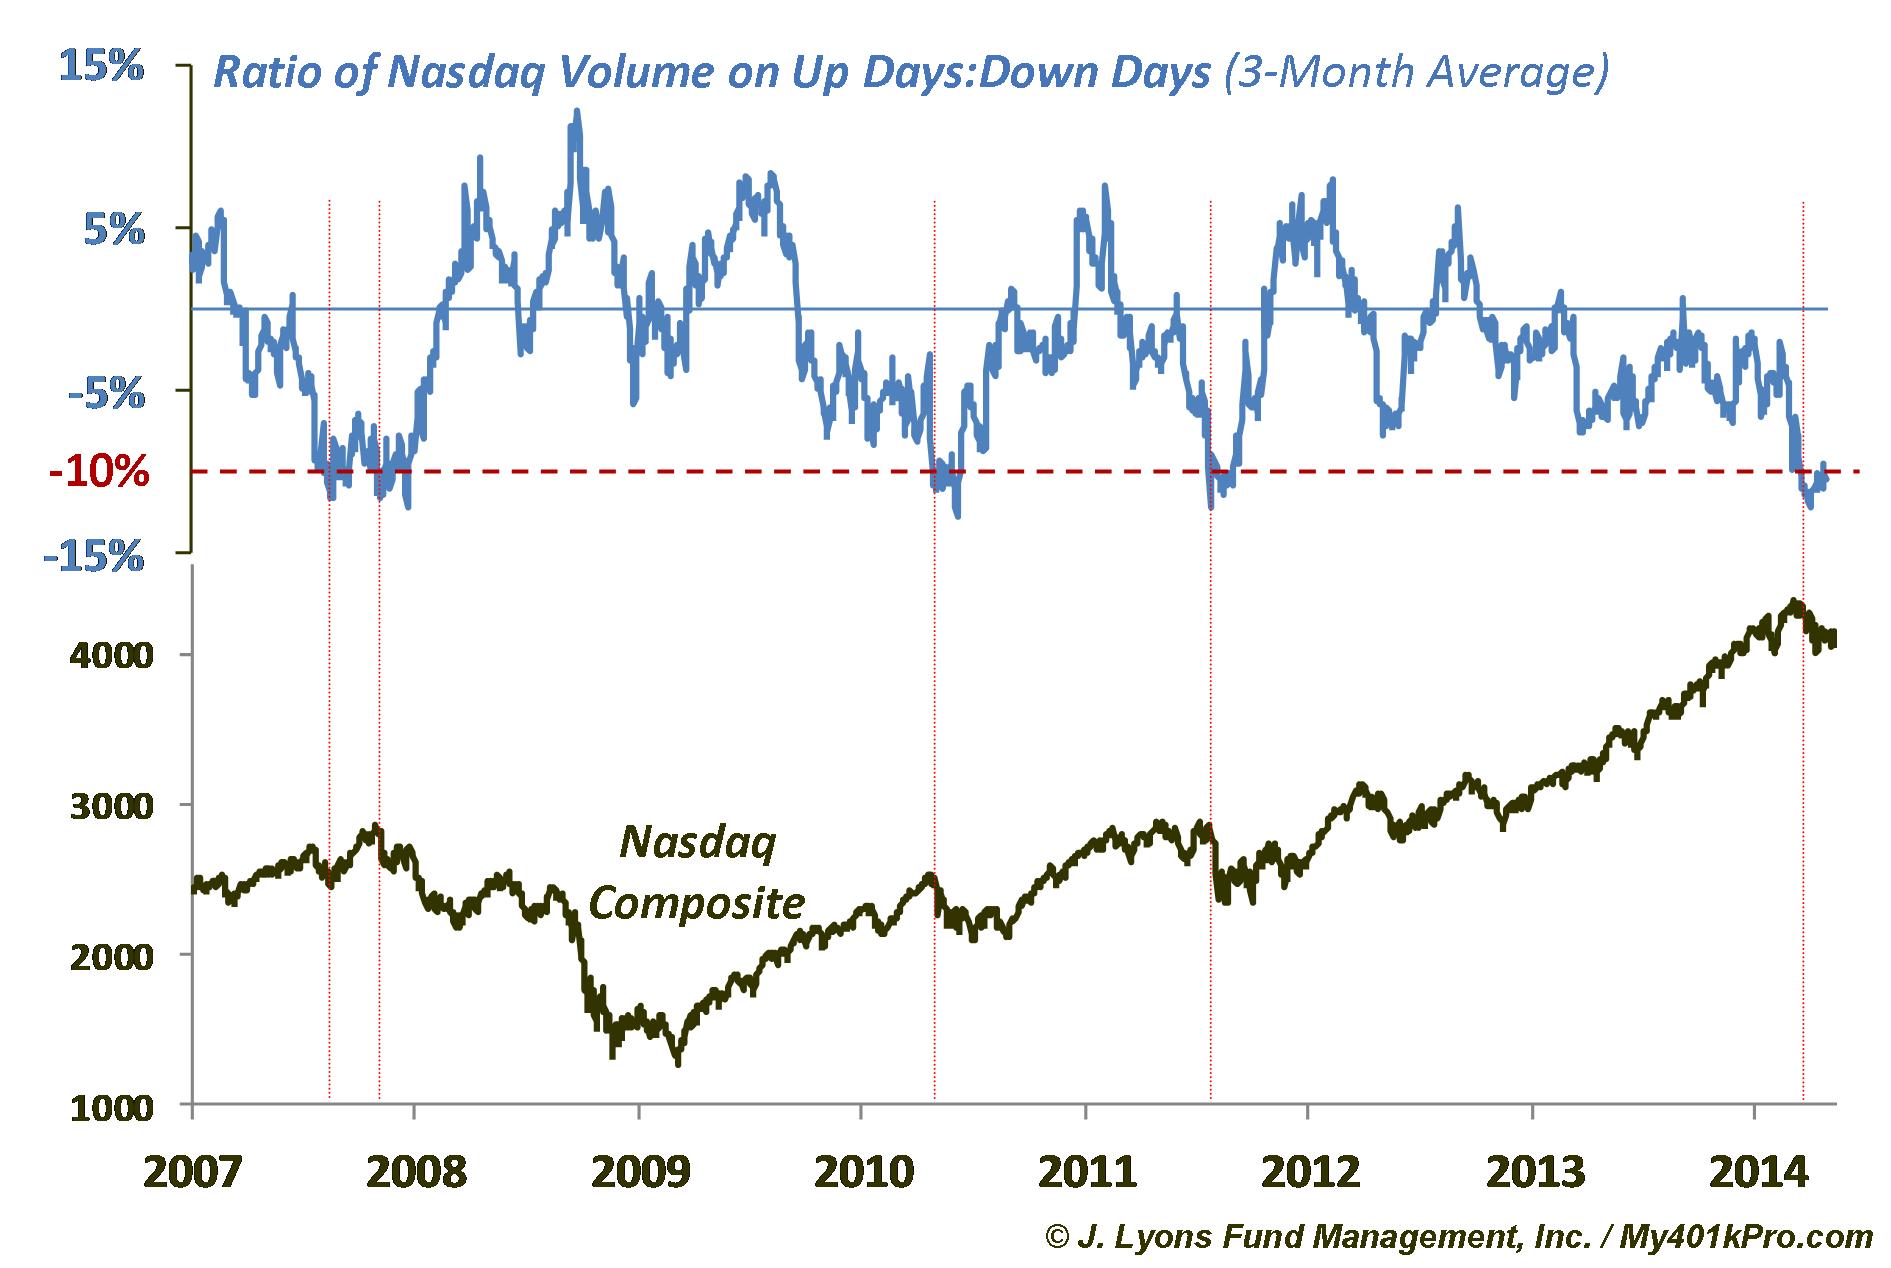
Furthermore, the 3-month average of Nasdaq "down day" volume vs. "up day" volume recently reached a level that has signaled further weakness to come in recent years. While this volume skew occurred in 2007, 2010 and 2011 after the Nasdaq had already declined somewhat, the market still lost an additional 15%, on average, in the 3 months following the initial skew reading.
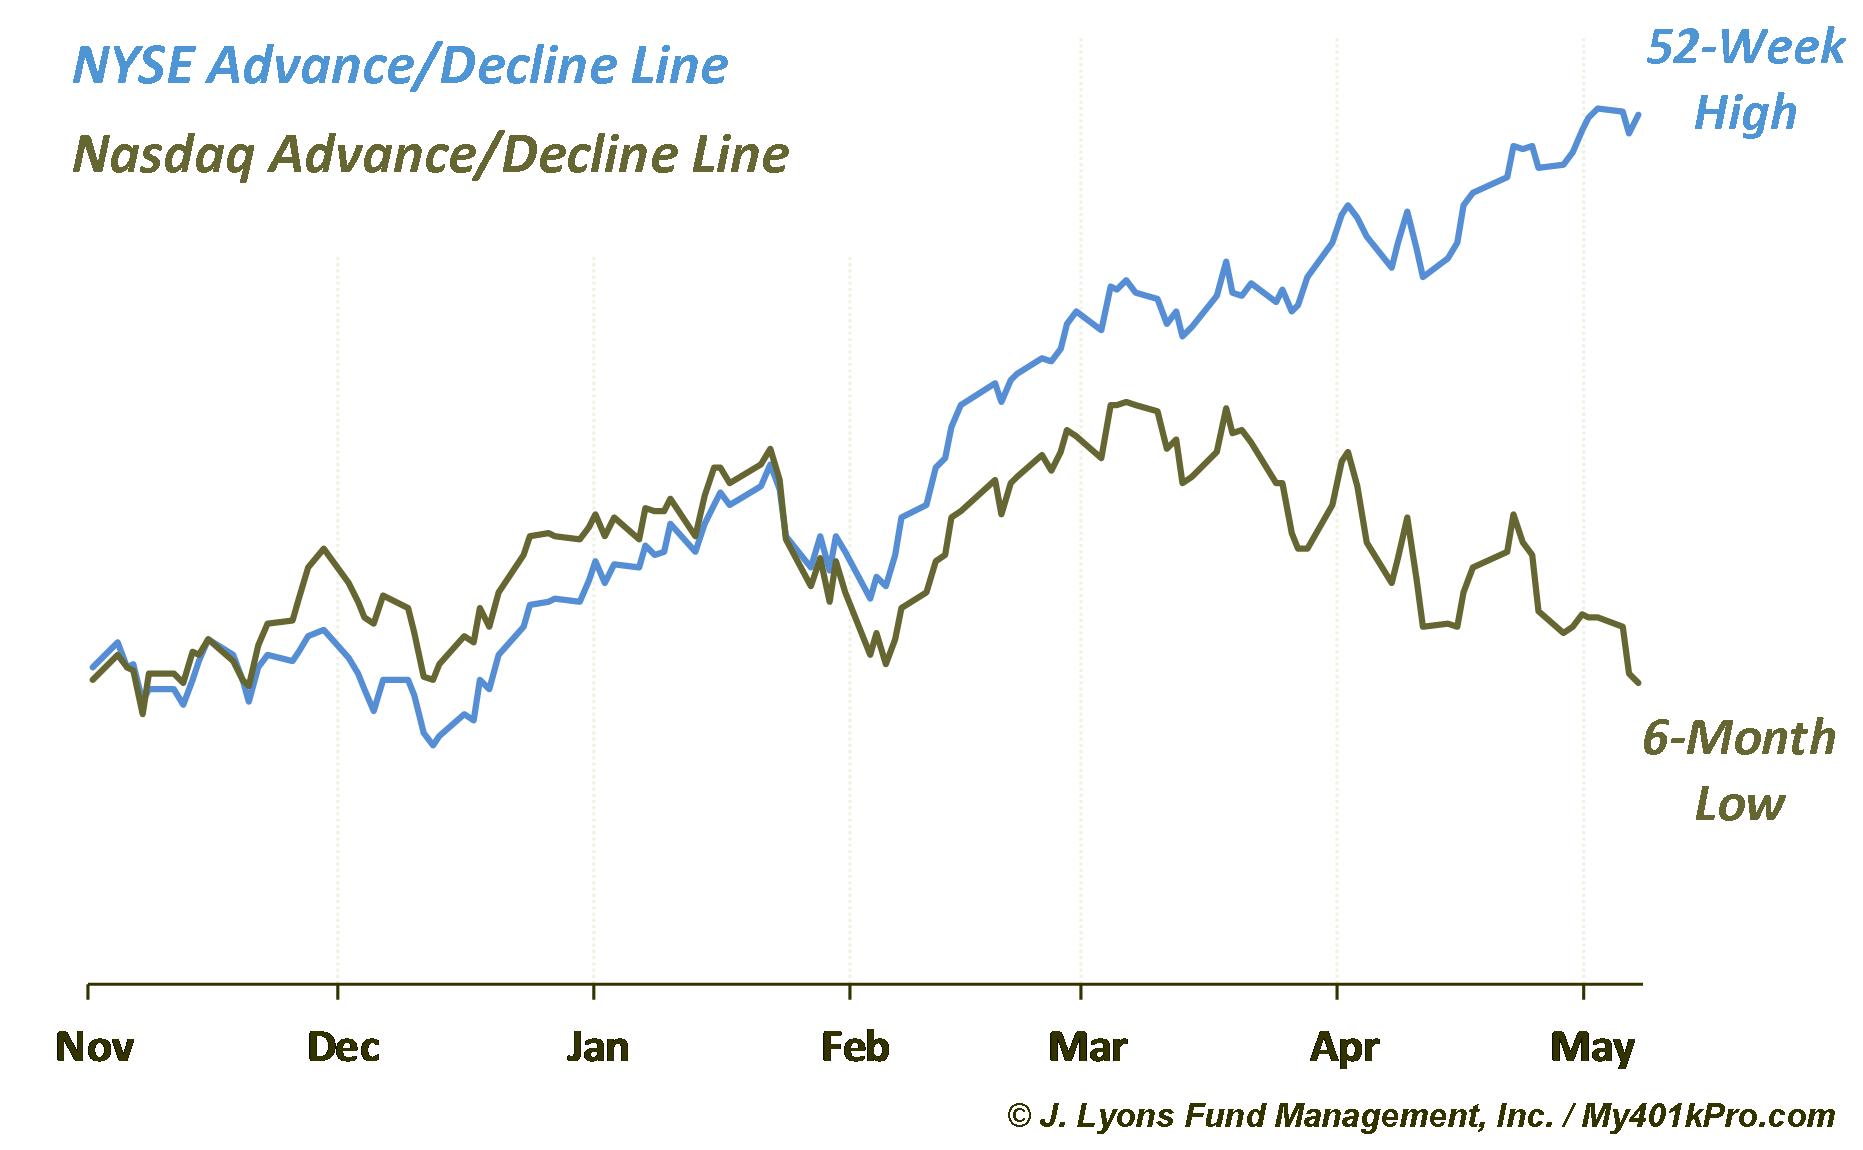
Divergences are symptomatic of market tops and 2014 might just be the year of the divergence. Perhaps the most striking of all divergences we've observed was a recent occurrence in which the NYSE Advance-Decline Line was at a 52-week high while the Nasdaq Advance-Decline Line hit a 6-month low. This is a stark example of the relative weakness in the Nasdaq market.
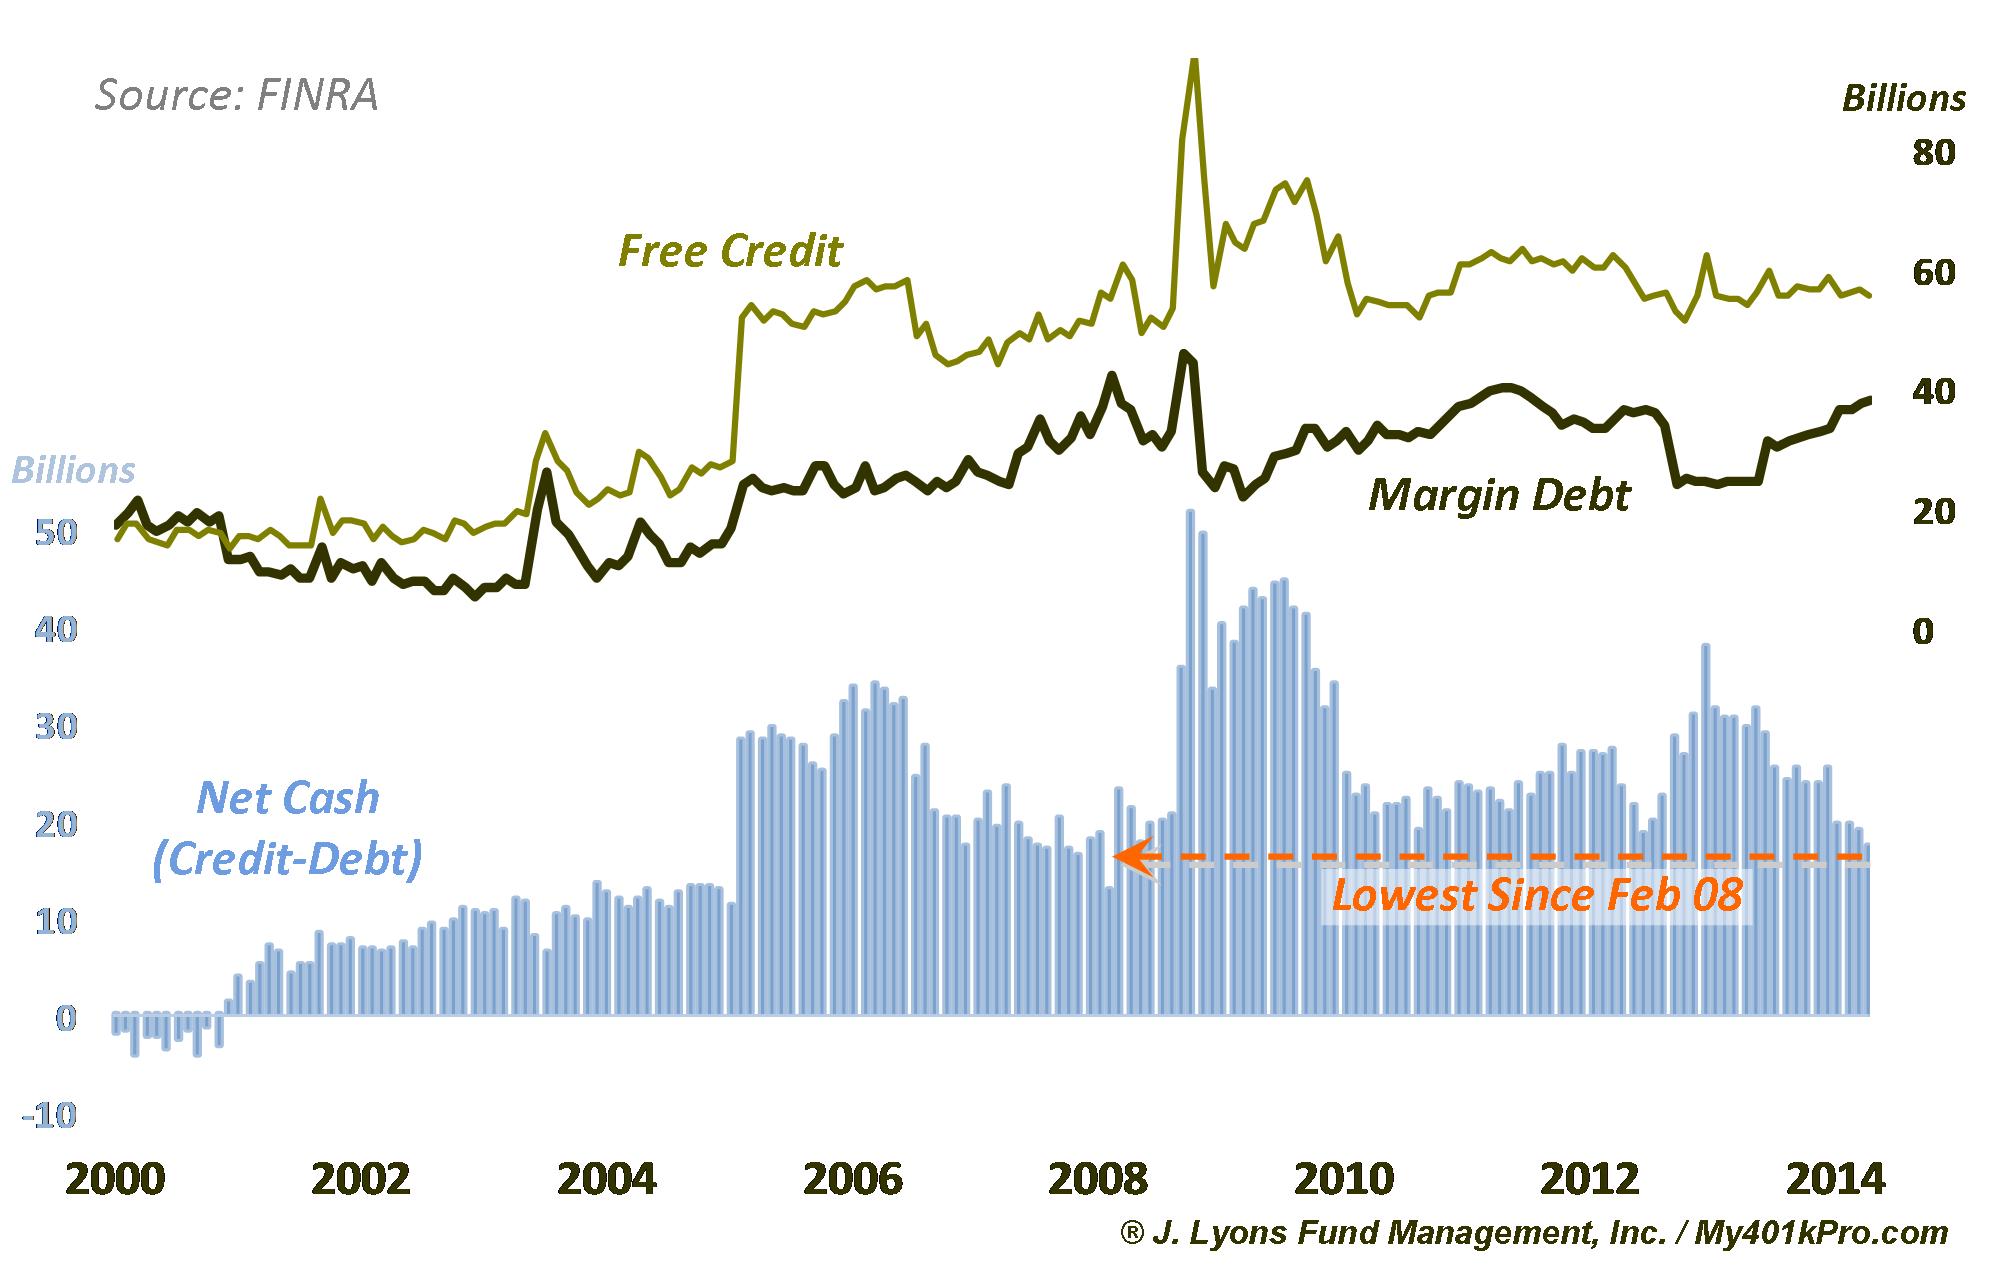
Another troubling sign regarding the Nasdaq market pertains to the margin debt situation there. While less volatile than the NYSE margin debt data, recent readings are not healthy. The level of net cash (free credit minus margin debt) in such accounts is at the lowest level since February 2008. Investors are highly levered and this will put added pressure on the market once it begins to roll over.
Bubbles Du Jour
Bubble sectors represent the ultimate in Rodmanesque stocks. On the way up, they provide an undeniable and powerful boost to the overall market. This is particularly true during the blowoff phase toward the end of their run as investors pour heaps of cash into them. Once the bubble pops, however, the same powerful influence is exerted on the market , only to the downside. The excess of investment dollars that fueled the formation of the bubble fuels its deflation as a massive liquidation process unfolds, causing the sector to be dead money for years. And while the broad market does not necessarily become dead money for that long, the popping of the bubble does bring serious negative reverberations to the rest of the market.
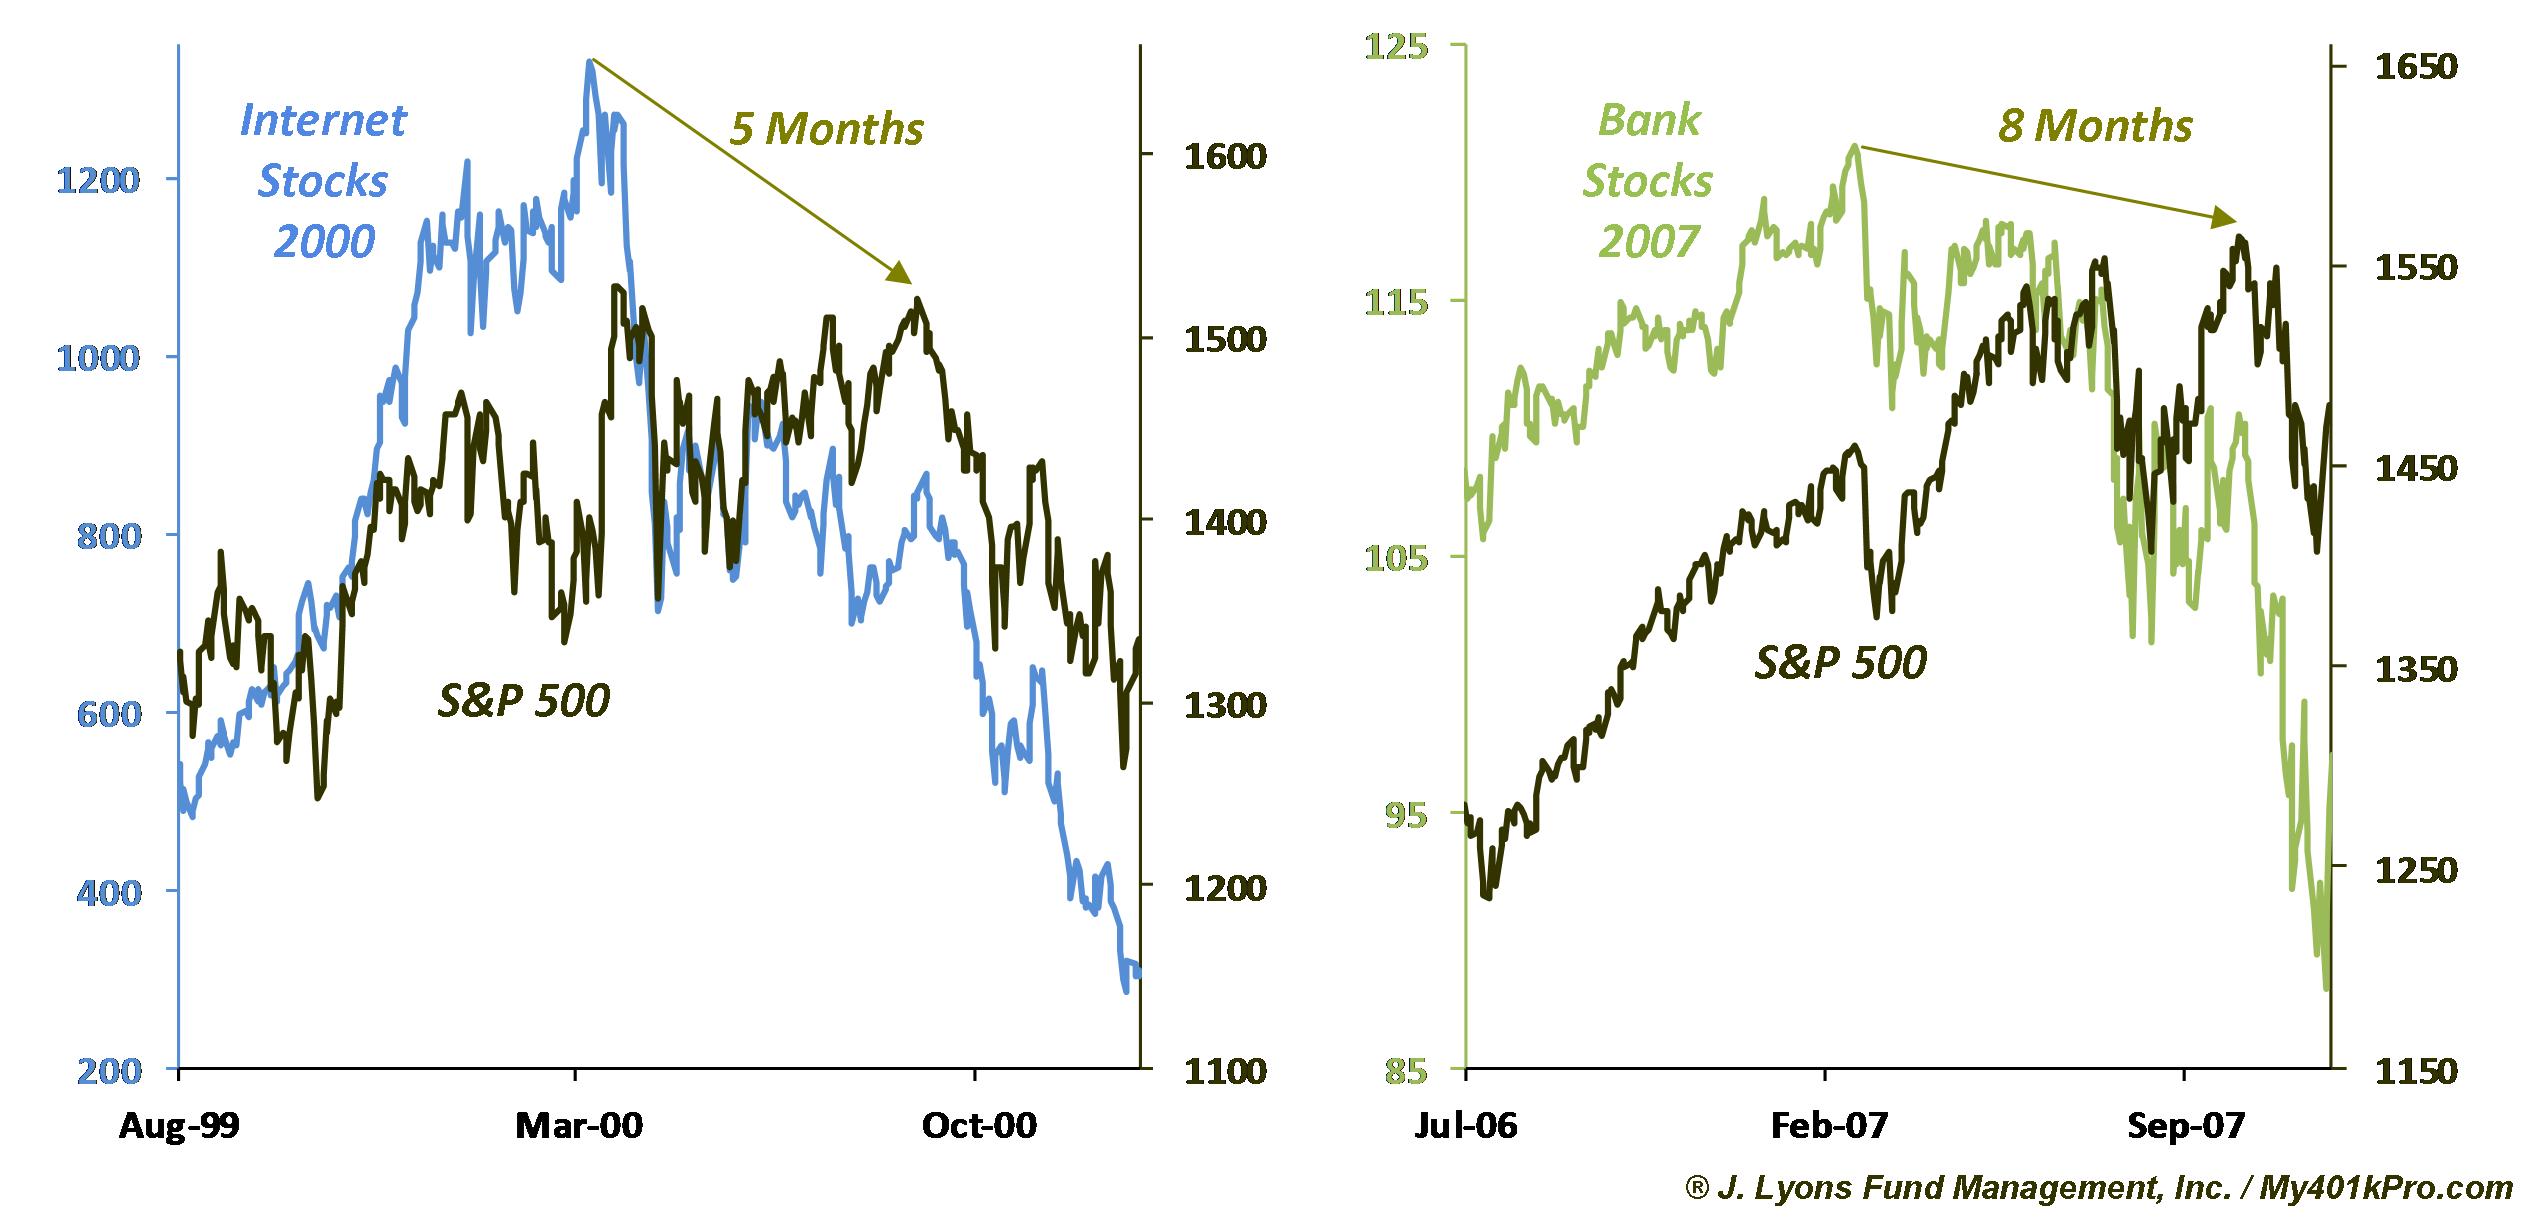
Historically, these bubbles have provided advance warning as they have tended to pop before the topping of the overall market. For instance, in 2000, the dotcom bubble burst prior to the S&P 500 collapsing. In 2007, it was the breakdown in the bank stocks that preceded the S&P 500 top.
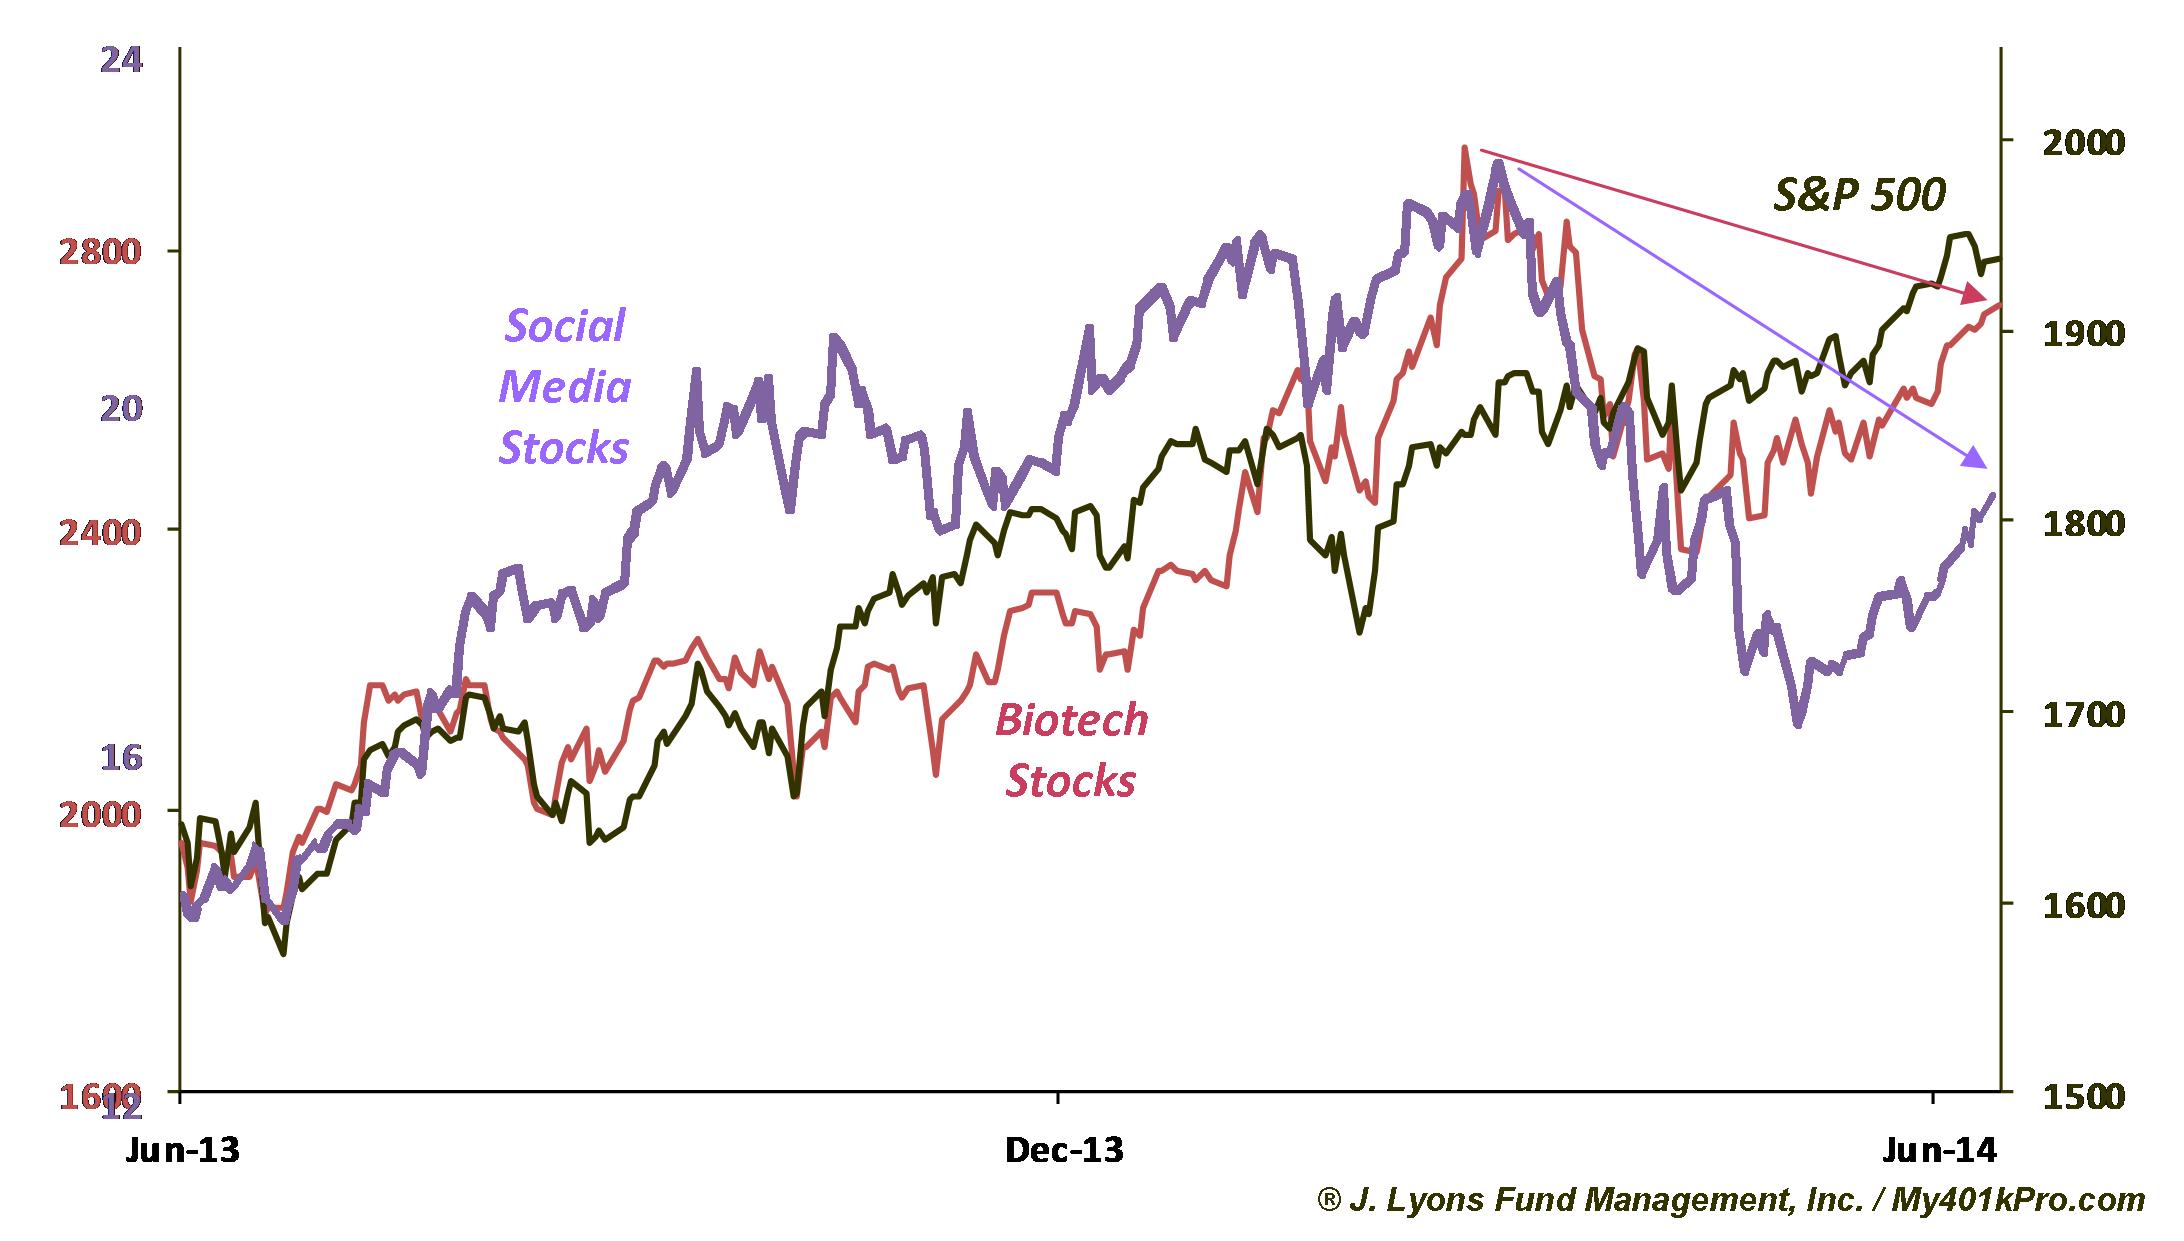
In the current cycle, it is the biotech and social media stocks that appear to be the bubbles du jour. The rampant rise in these stocks fueled buying frenzies in those sectors in recent years. Those bubbles appear to have popped, however. Even as the S&P 500 has continued to march to new highs, biotech and social media stocks remain far below their previous highs.
If the biotech and social media stocks have indeed topped, the risk of an aforementioned large-scale liquidation process is significant. This scenario is supported by a study of margin debt on the NYSE. As is common knowledge, NYSE margin debt has gone to record heights during the current market cycle. This poses a great potential risk to the equity market rally. We say potential because it is only when this margin debt is unwound that the risk is manifested. Looking at previous cycles, we see that margin debt peaked several months before the broad market topped. That tendency gives us a clue as to where much of that debt is directed: the bubbles.
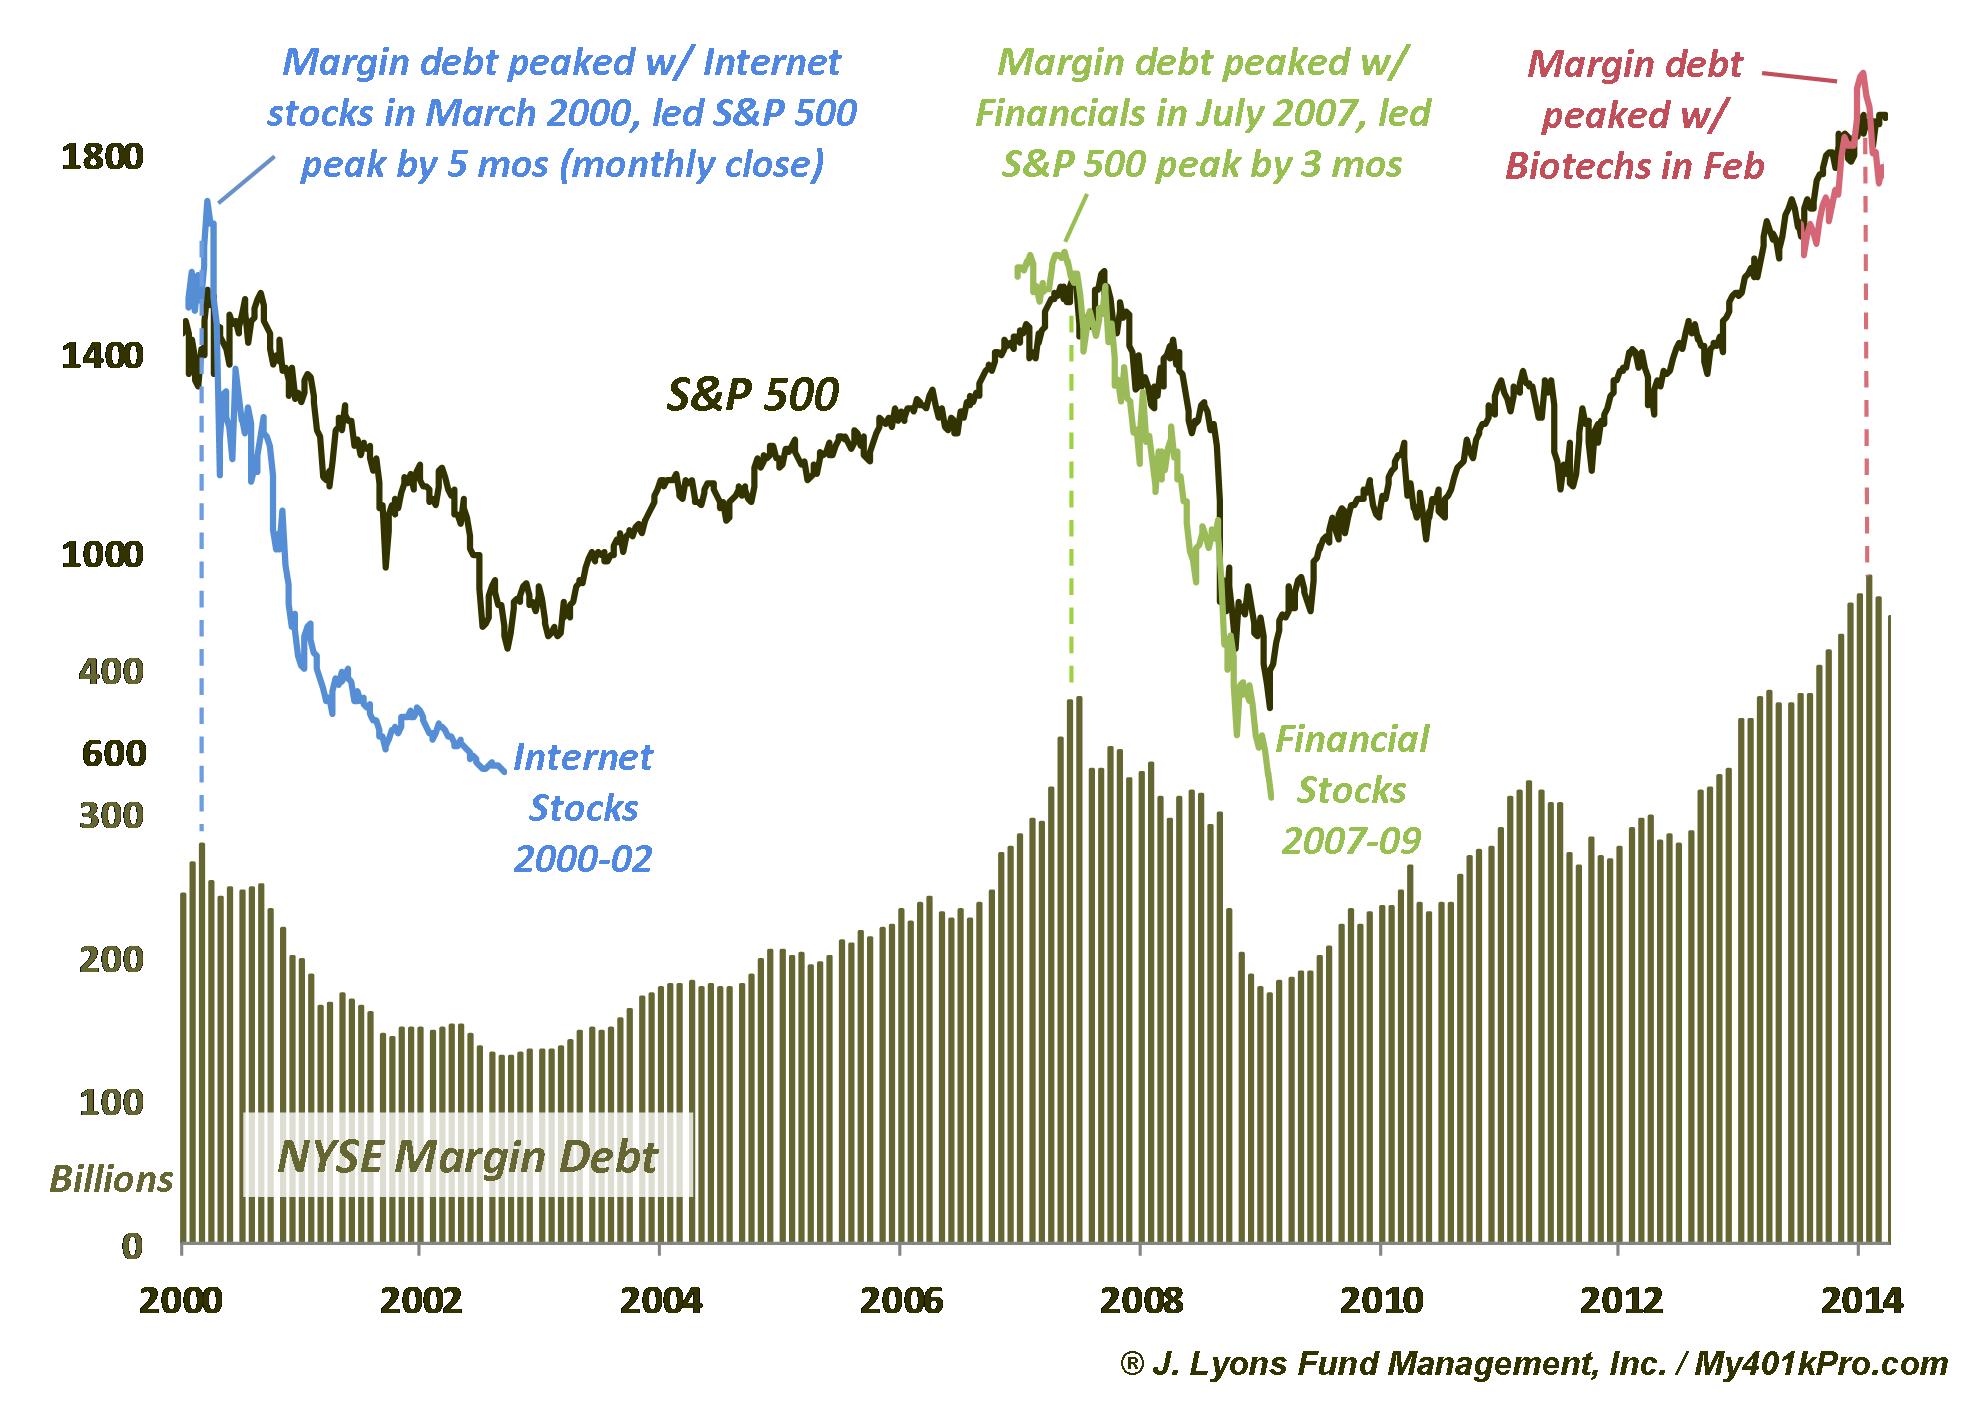
In 2000, record-high margin debt topped in March along with the popping of the dotcom stocks. As the selloff in internet and tech stocks gathered steam so too did the unwind of margin debt, eventually pressuring the broader market. The same thing occurred in 2007. Margin debt peaked with the financials several months before the broad market. The record amount of margin debt eventually unleashed its potential risk on the market in widespread liquidation over the following year. Looking at the current situation, we see that margin debt peaked in February, not coincidentally along with biotechs and social media stocks. If this is the beginning of the margin debt unwind, considering record levels there, the potential risk is massive.
Conclusion
In 1995, the San Antonio Spurs had the best record in the league and entered the playoffs as the favorite to win the championship. In game 5 of the Western Conference Finals against the 6th-seeded Houston Rockets, their talented but enigmatic power forward, one Dennis Rodman, missed most of the 1st quarter after showing up late to the game and later got into a heated argument with his coach on the sidelines. The Spurs were blown out in the game and went on to lose the series. While the S&P 500 continues to chug along to new highs, other components in the market have stopped participating in the rally, forming some serious cracks in the market's "chemistry". High risk/high reward segments llike many Nasdaq stocks and small caps, as well as recent high flyers like biotechs and social media stocks have either broken down or are showing worrisome relative weakness that has spelled trouble in the past. These areas, which have provided a boost to the market in recent years given their high beta, pose a serious threat to the rally should this beta begin to exert its pressure to the downside. So perhaps the broad market will win some more games, i.e., new highs, with its $29 trillion dollar central bank payroll. However, when it's game over on the rally and the market starts dropping because some small cap head-butted a referee or a biotech stock skipped the game to gamble in Vegas, don't say there weren't warning signs.
Dana Lyons
The
commentary
included in this newsletter is provided for informational purposes
only. It does not constitute a recommendation to invest in any
specific investment product or service. Proper due diligence should be
performed before
investing in any investment vehicle. There is a risk of loss involved
in
all investments.