| July 2012 | Posted July 5, 2012 |
Investors' Last Chance?
The current rally may be investors' last chance to finally change strategies to one that will actively protect their portfolio when the forthcoming third storm of this secular bear market strikes.
“A man must consider what a rich
realm he abdicates when he becomes a conformist."
- Ralph Waldo Emerson
For the past dozen years, most investors have followed the conventional investment approach of “buy-and-hold”. One could hardly blame them since, whether coming from their investment advisor, their retirement plan literature, Wall Street, academia, etc., that has been the strategy they have been advised to take. Yet, far from building toward a sufficient retirement nest-egg, the vast majority of investors have actually experienced a negative return over that time. A hypothetical $100,000 retirement account invested in the S&P 500 at the top of the market in 2000 would have been worth only about $91,500 at the recent market top…12 years later.
A $100,000 retirement account invested in the S&P 500 at the top of the market in 2000 would have been worth only about $91,500 at the recent market top…12 years later.
Of course, the culprits were two brutal bear markets that saw the stock market lose some 50% of its value. The problem (again) is that the widely accepted, conventional buy-and-hold approach offers investors zero protection against losses during such declines. Unfortunately for investors, particularly those nearing retirement age, these substantial blows to their portfolio can derail their entire retirement plan.
Last month, we detailed how significant risk was again accumulating in the market across various time frames, from short to medium to long-term. Such a risk profile also existed in 2000 and 2007, just prior to the last two market meltdowns. Clients and long-time readers know that, as money managers, our allegiance is to objectivity rather than a perma-bias, either bullish or bearish. Therefore we are generally not prone to hyperbole. However, the current stock market bounce may be your last chance to seek shelter before the gathering storm hits.
For investors who would like to avoid a third strike, now is the time to break from conformity and make the crucial decision to change investment course. And we mean right now. Place your retirement funds in the care of a strategy that will first and foremost actively seek to manage your investment risk in order to avoid those devastating losses that have derailed your retirement plan in the past.
Investors who choose to continue along the same buy-and-hold course that has already dealt them two crushing blows are choosing to blindly accept as their retirement nest-egg whatever returns the stock market lottery doles out. The following outlines the risks that they currently face. And just to be clear, the potential investment losses that we highlight below do not represent some Armageddon scenario. They are blatantly realistic.
Disclaimer: While this study is a useful exercise, JLFMI's actual investment decisions are based on our proprietary models. Therefore, the conclusions based on the study in this newsletter may or may not be consistent with JLFMI's actual investment posture at any given time. Additionally, the commentary here should not be taken as a recommendation to invest in any specific securities or according to any specific methodologies.
Current Market Risk Based on Historical Secular Precedents
As with much of our analysis and commentary over the past dozen years, we studied stock market behavior during historical secular (long-term) bear markets to provide an indication as to the risk present at this juncture of the current secular bear market. These historical precedents have been remarkably instructive over the past twelve years and we have no reason to suspect that to be any different as it pertains to this study.
Declines Following the 2nd Cyclical Rally within a Secular Bear Market
As we have explained in the past, we use the term “secular” to describe long-term market cycles lasting up to several decades. The market is currently undergoing a secular bear market that began in 2000. Meanwhile the term “cyclical” is used to describe market moves that last several years, on average. The rally from March 2009 to the present is a cyclical rally and is the 2nd cyclical rally during this secular bear market, with the first lasting from 2003 to 2007.
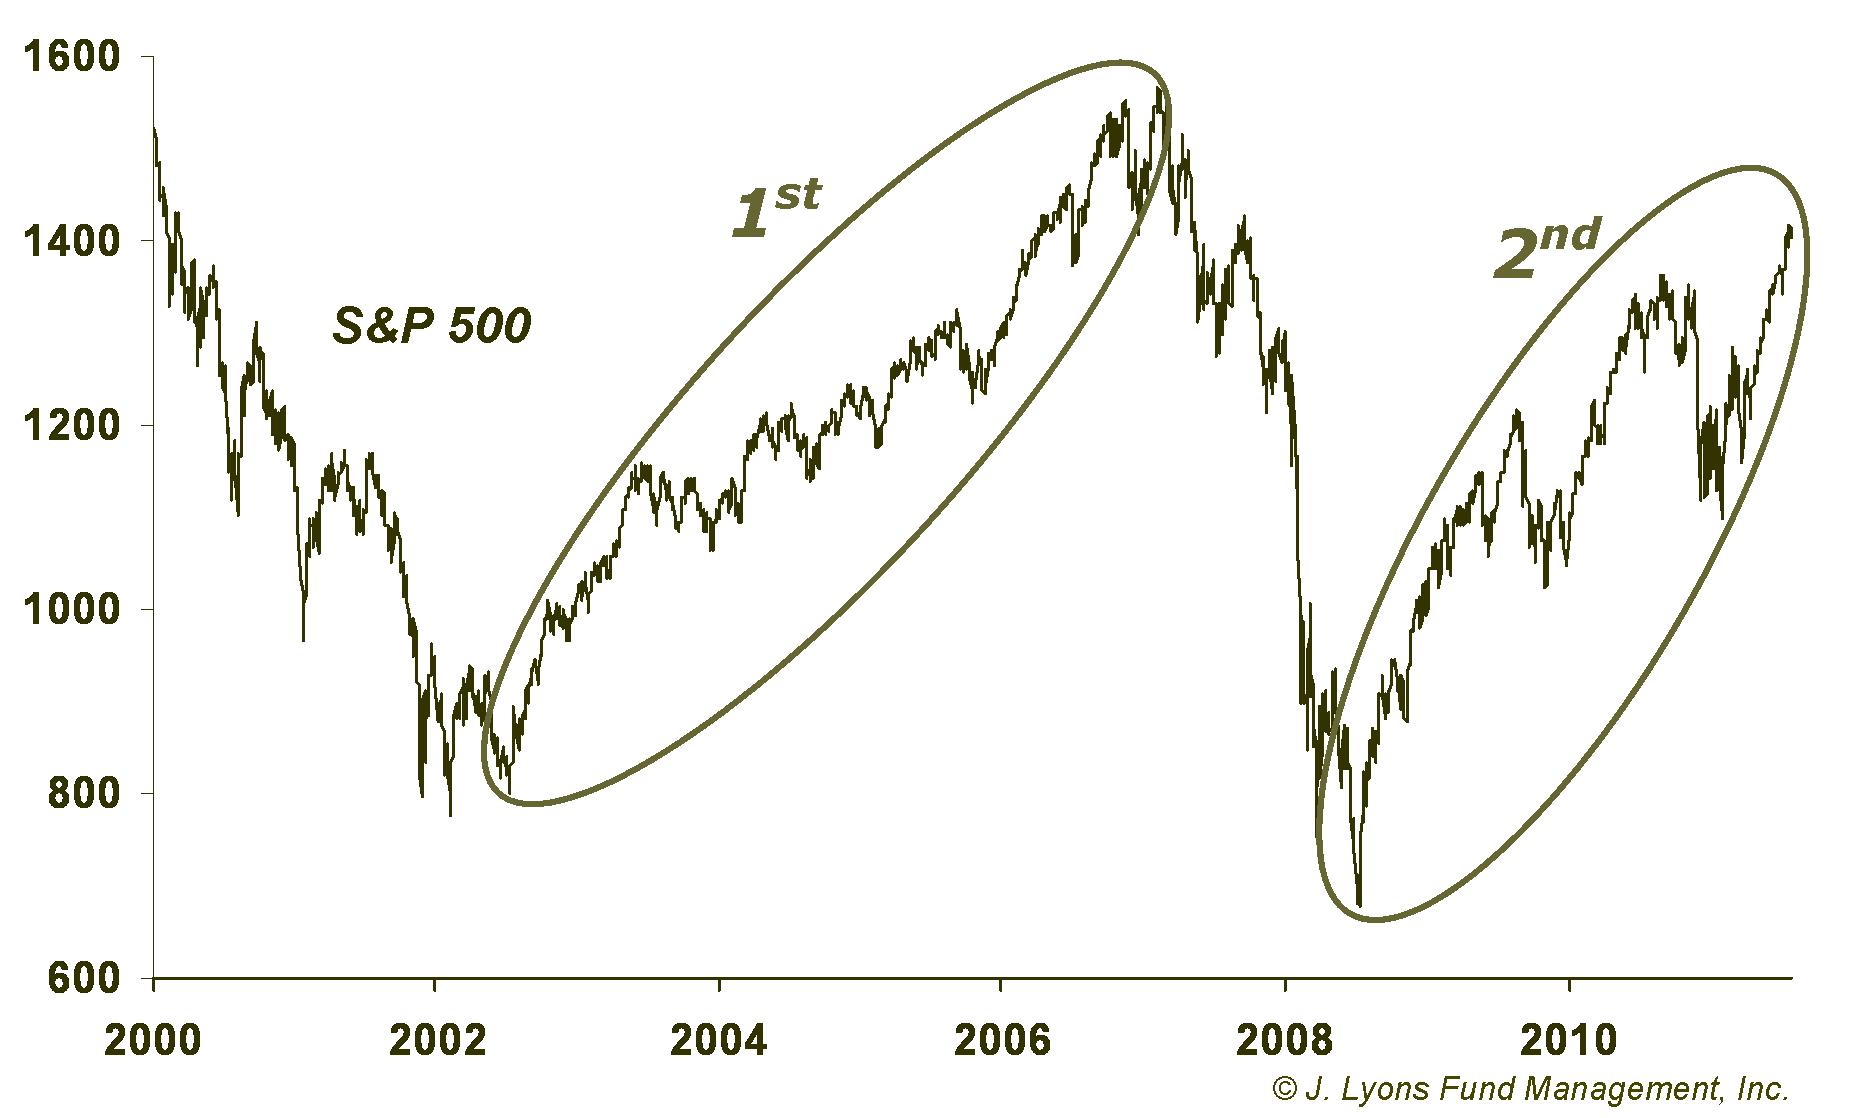
Studying the aftermath of 2nd cyclical bull rallies during past secular bear markets can give us a clue as to the potential risk the market faces once this cyclical bull is complete. Specifically, we are referring to the 1929-1949 and 1966-1982 secular bear markets. The 2nd cyclical bull rallies during those secular bears are marked below.
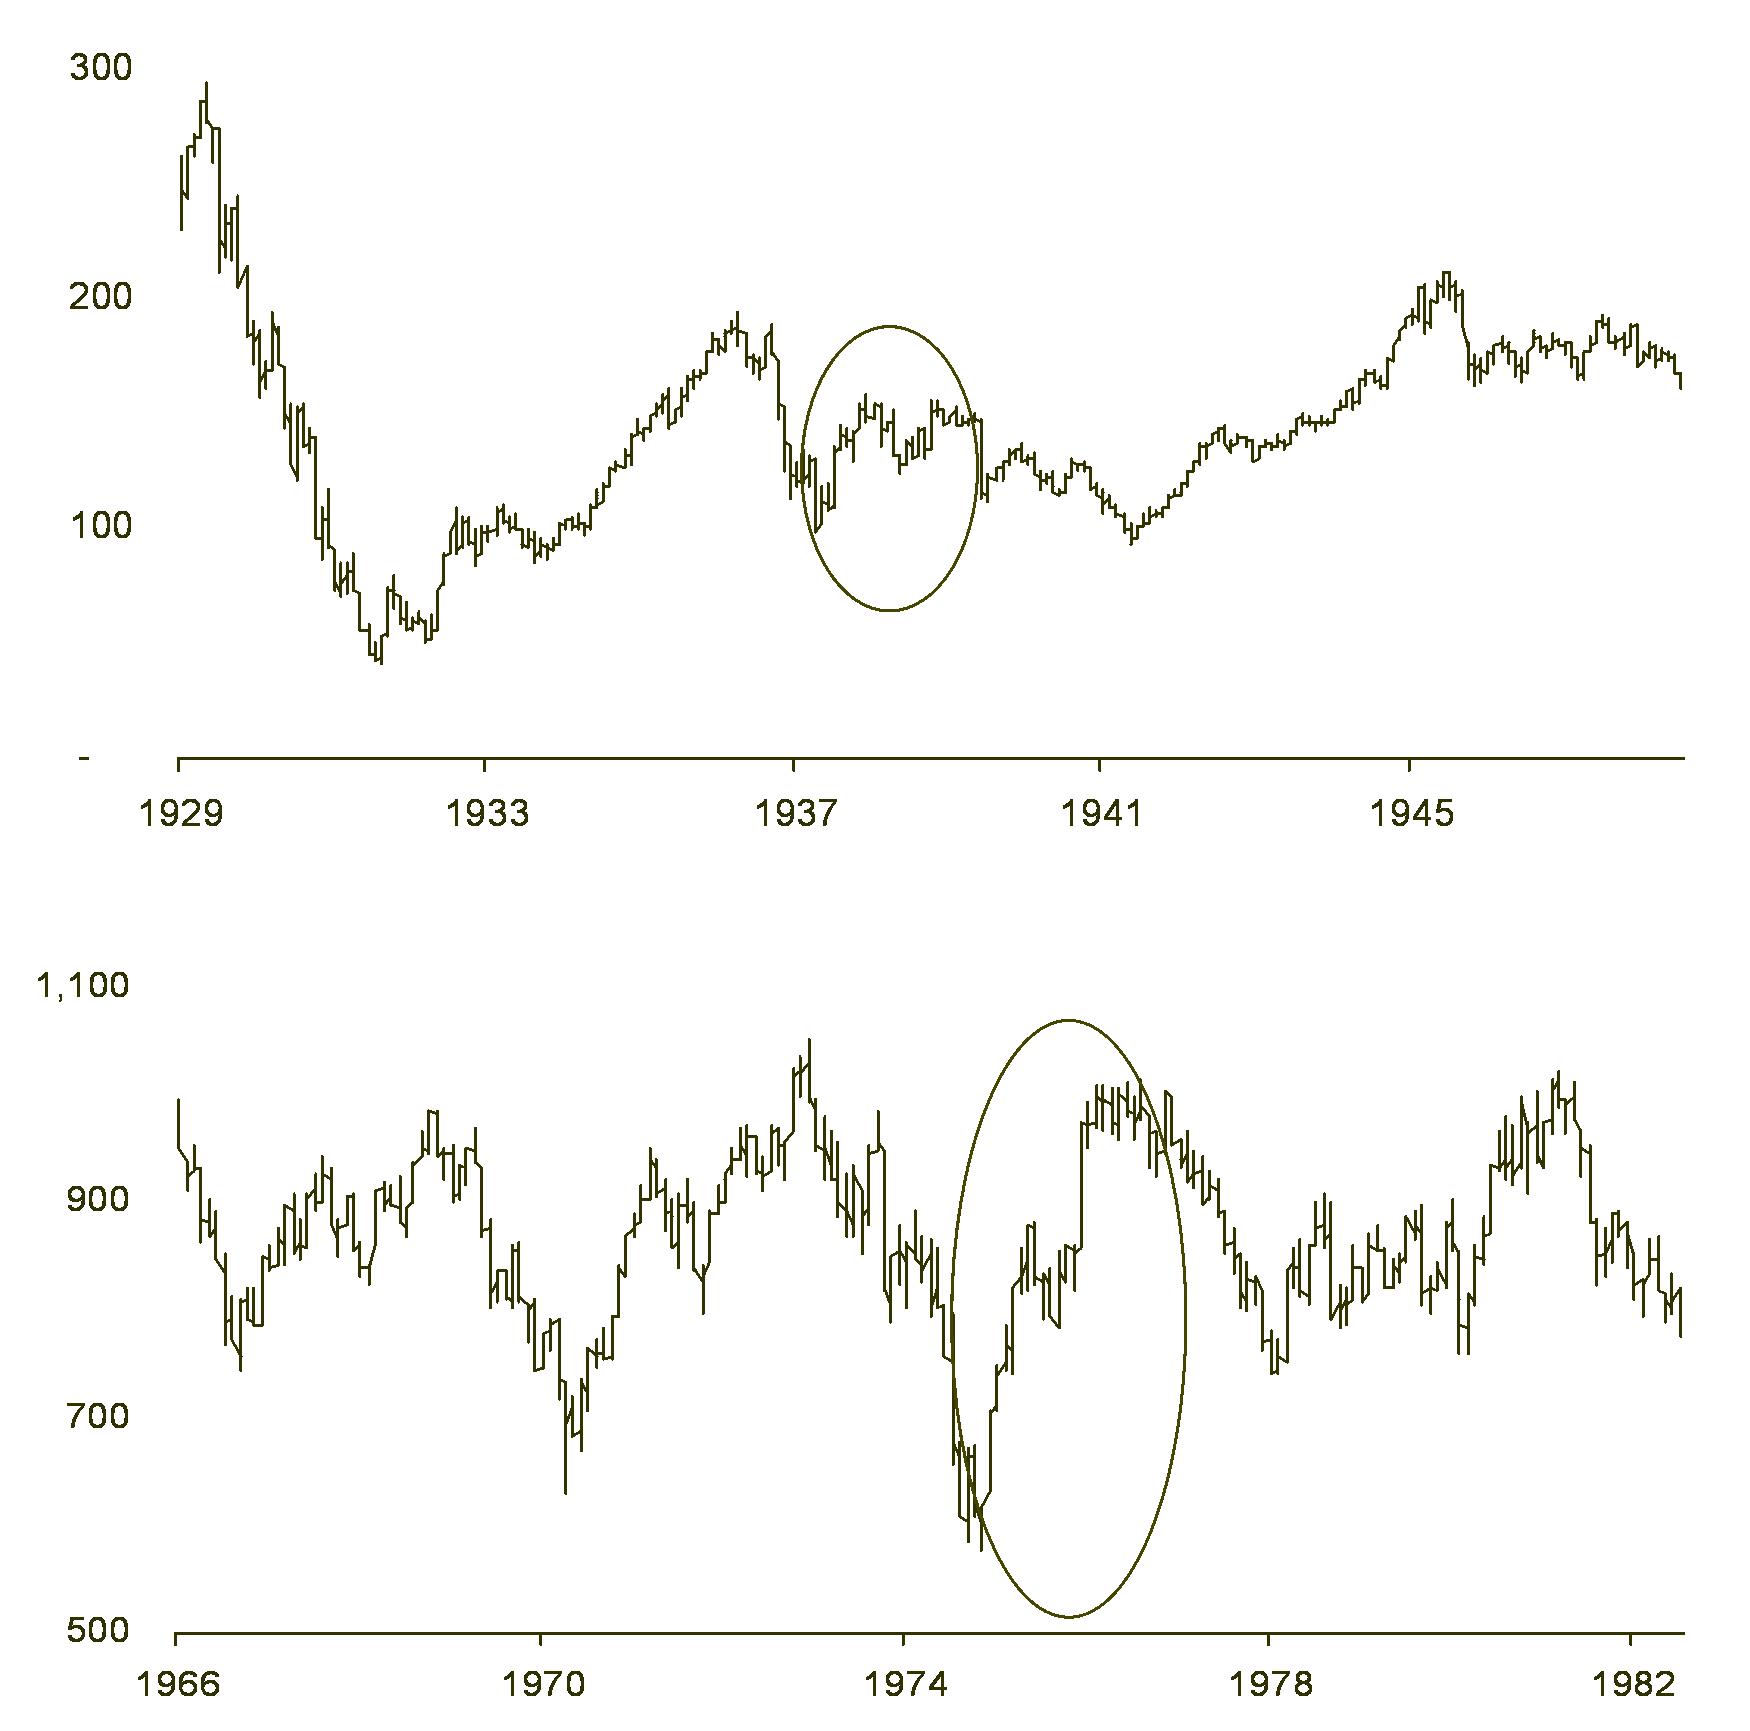
From just a quick glance, it is apparent that the stock market
struggled for several years after the cyclical rallies ended in 1939
and 1976. Specifically stocks suffered, on average, a 25% loss
from the rally high sometime over the next few years. Additionally, it
took the market an
average of five years to finally surpass the rally highs. Furthermore,
even after surpassing the rally highs, stocks remained in the general
area of those highs for another three years. Therefore, on average, it
took eight years from the completion of the second cyclical rally
before the stock market began to make sustainable gains for investors.
| Post-Rally Loss |
Time until Rally High is Broken |
Time until Rally High is Permanently Broken | |
| Average of 1930's & 1970's | -25% | 5 years | 8 years |
| Projections for Current Market | S&P
500: 1070 |
2017 | 2020 |
Applying that 25% loss to the current market would put
the S&P 500 at around 1070 sometime over the next few years
(using
the recent high of 1422.) That 25% loss would bring the value of that
hypothetical retirement investor’s portfolio from $91,500 down to
$68,600. Perhaps worst of all, if the market follows the historical
pattern, that investor will not recover those losses on a sustainable
basis until 2020.
Risk: 25% downside from the recent market high = hypothetical retirement investor’s portfolio will drop from $91,500 to $68,600
Retracement of Rallies Following Secular Bear Market Lows
Another way to gauge downside risk is to measure the amount of the previous rally that is potentially vulnerable to being lost, or retraced, during a subsequent decline. Readers may recall that we covered this angle in our January Newsletter as it related to rallies following secular bear market lows.
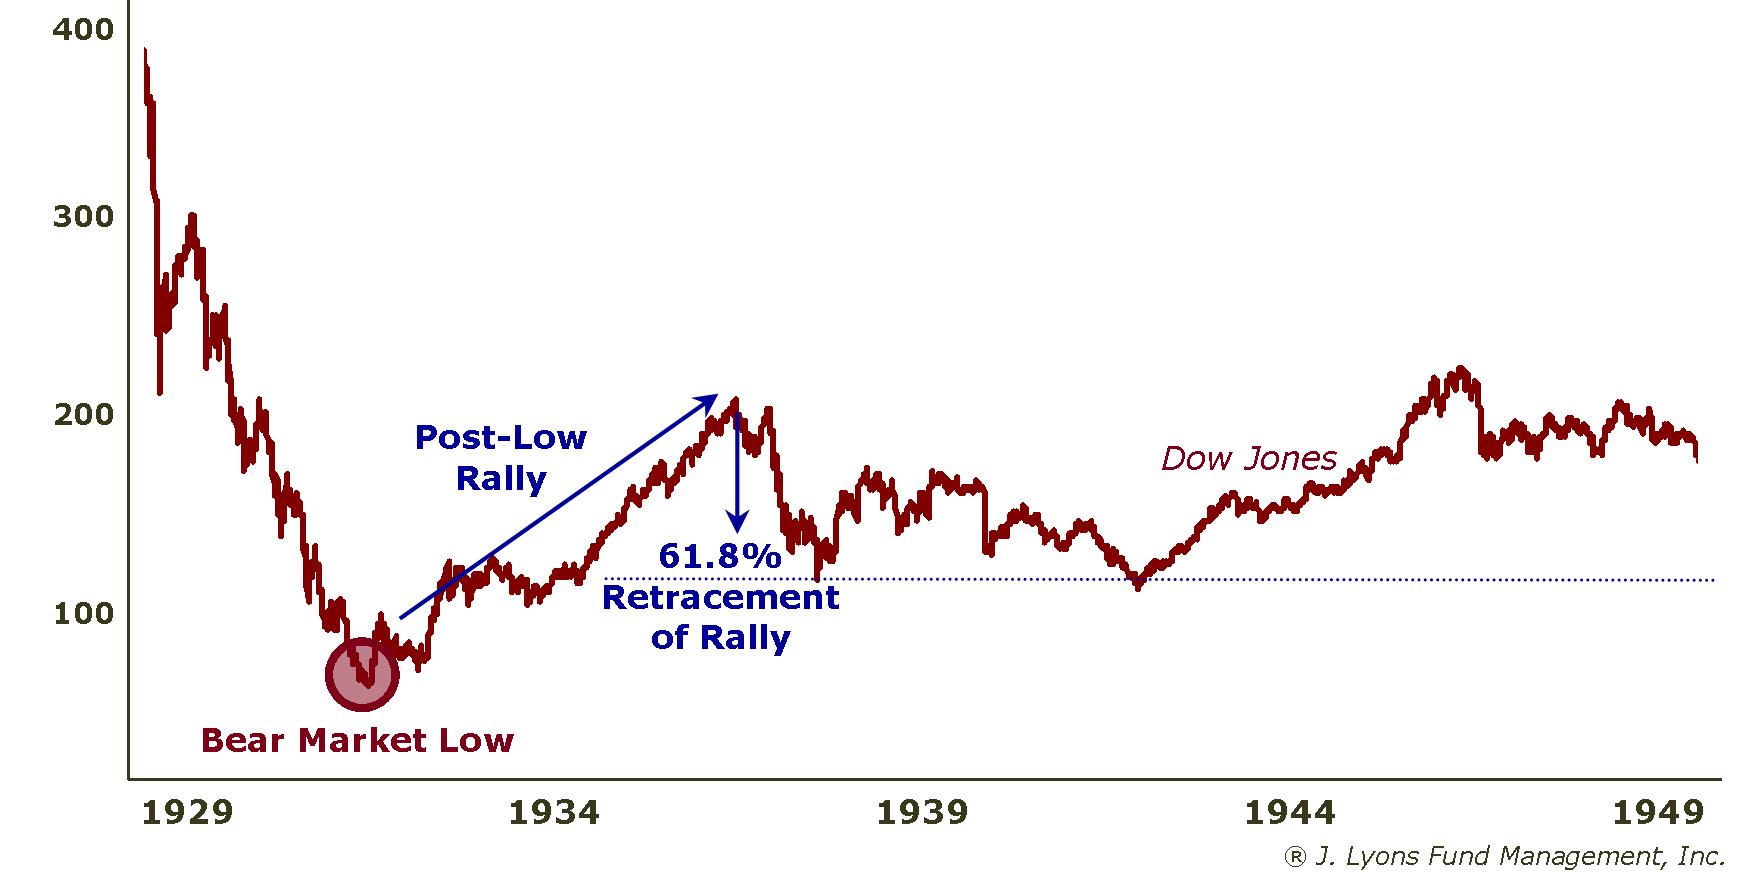
The secular market from 1929-49 made its absolute low for those twenty years at the end of the first cyclical decline in 1932. The 1966-82 secular bear market made its low during the second cyclical decline in 1974. After the subsequent cyclical rallies off those lows, the market was able hold a significant level above each of those lows for the duration of both of those bear markets. That significant level is signified by a 61.8% retracement of the rally that occurred immediately following the bear market low. In other words, for the duration of the secular bear, the market essentially never lost more than 61.8% of its gains made from the bear market low to the subsequent rally peak.
To illustrate, after the rally from the low in 1932 to the peak in 1937, the Dow never retraced more than 61.8% of the move, twice bouncing off that approximate level in 1938 and 1942:
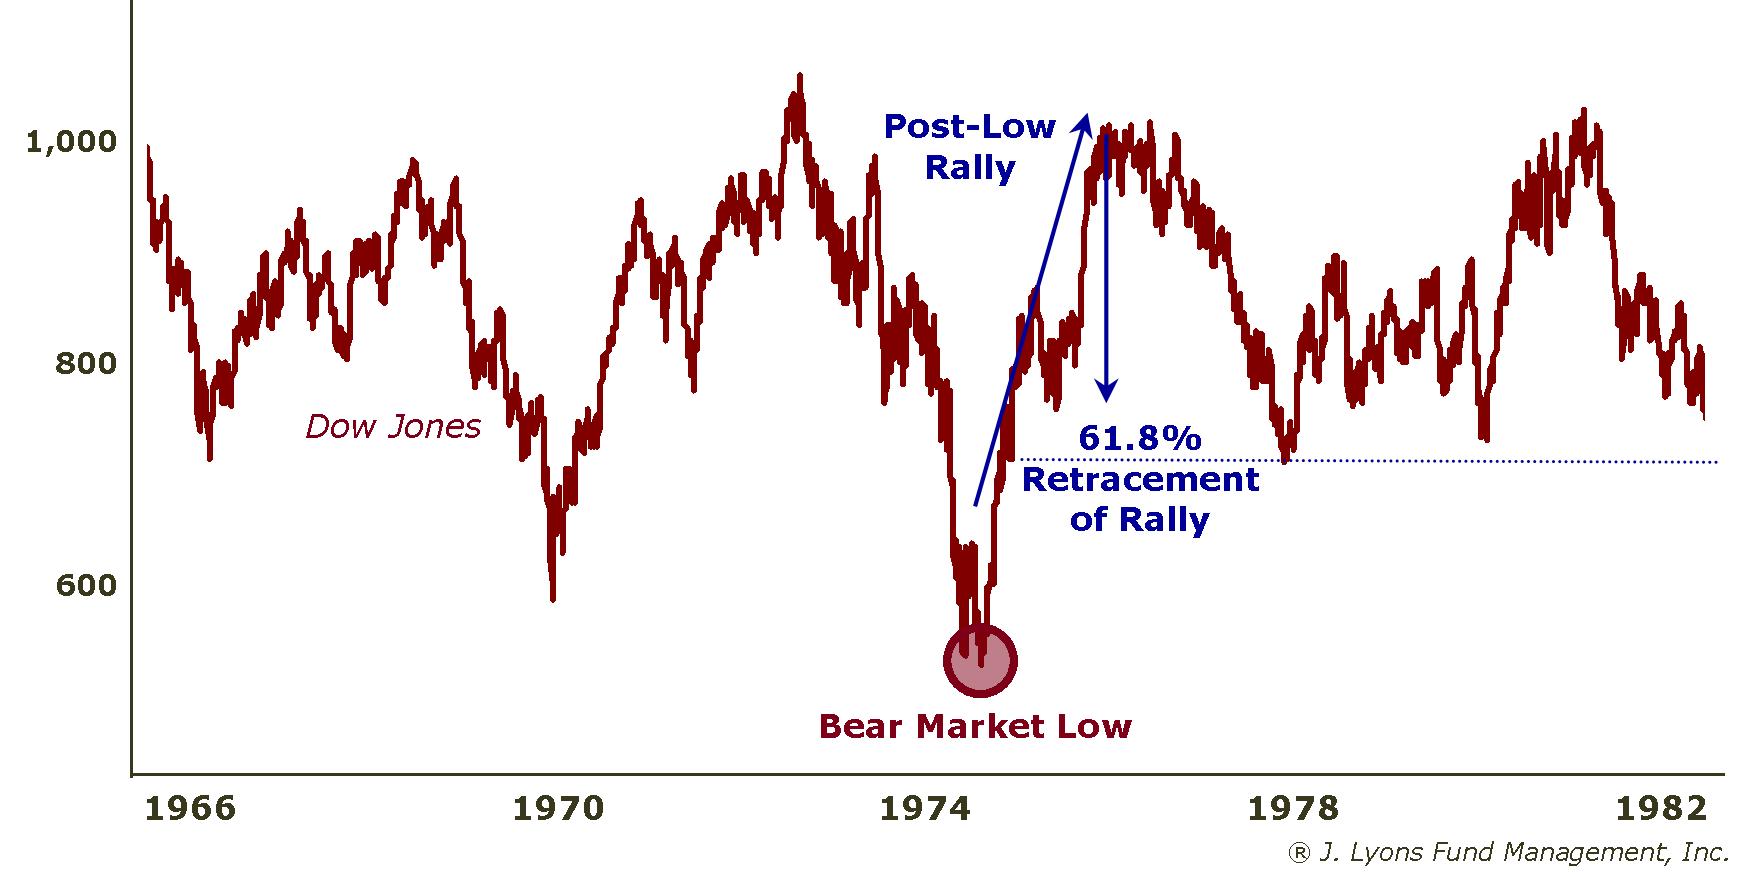
Likewise,
during the last secular bear market, the Dow held the 61.8% retracement
level of the rally from the secular bear low in 1974 to the subsequent
rally peak in 1976. As in the 1929-49 bear, the market bounced off
almost that exact 61.8% retracement level twice, in 1978 and 1980:
As we discussed in January, 61.8% is not just a random level
that we data-mined from the prior secular bear market incidents. It
is one of the "Fibonacci numbers", a specific
sequence of numbers,
often recurring in nature and many other walks of life, including
financial markets. They are most often used when
considering retracements of market rallies or
declines. 61.8% is a major Fibonacci retracement number and therefore
it is not a major coincidence that that level held as support following
lows during the previous secular bear markets.
The low point of the current secular bear was made at the March 2009 bottom, prior to the commencement of the current cyclical rally. Using the previous secular bear markets as a guide, the current downside risk is a 61.8% retracement of that cyclical rally from March 2009 to the recent cyclical rally high:
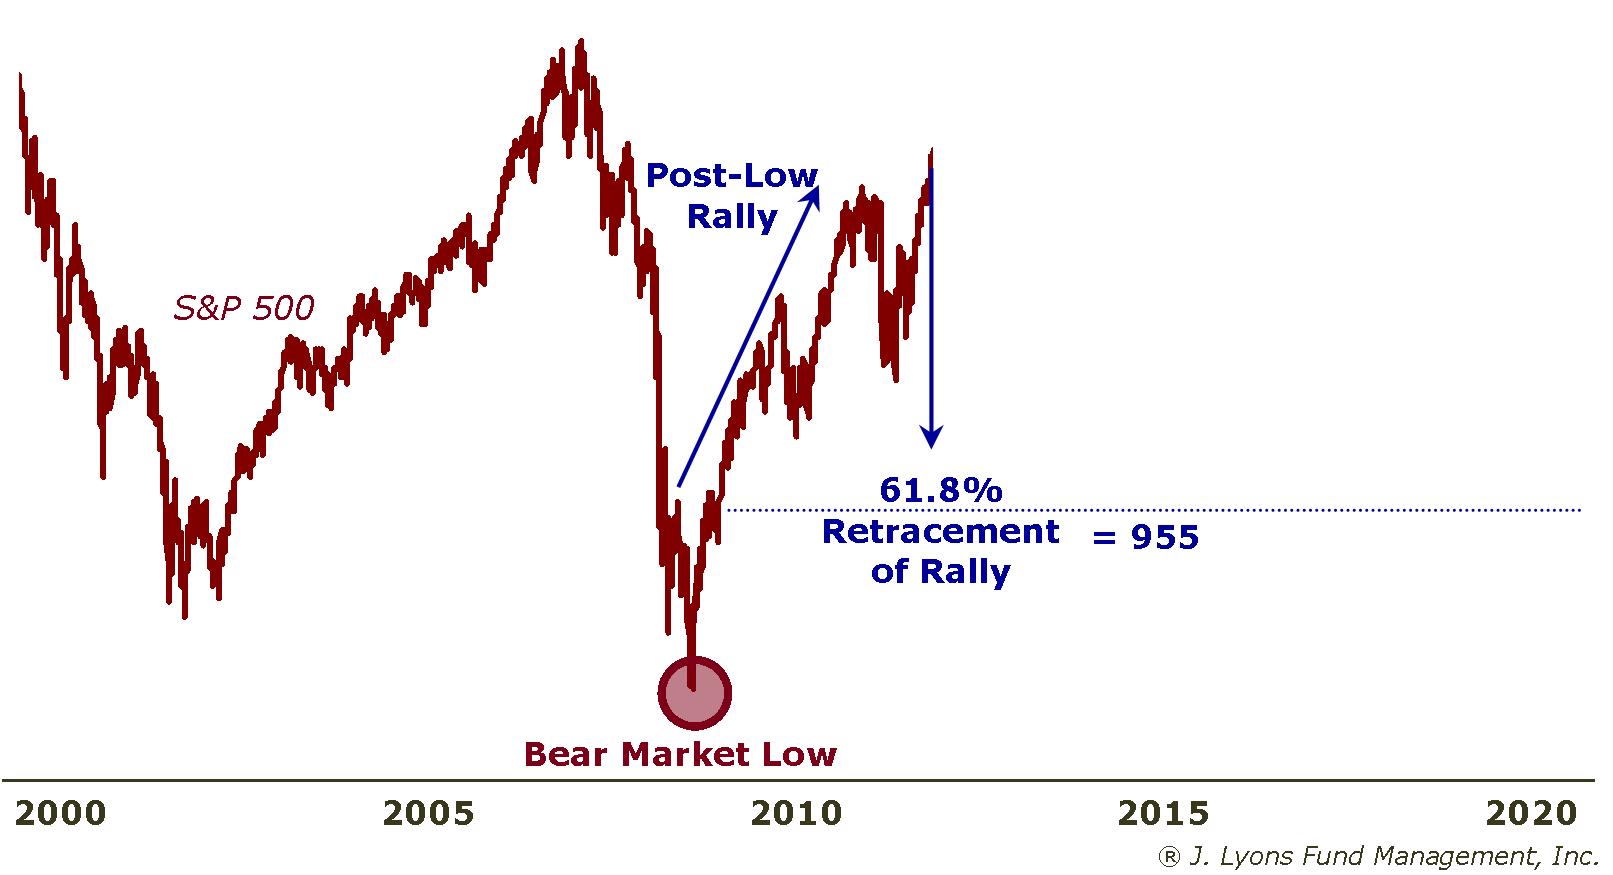
Specifically,
the March 2009 low in the S&P 500 was 666, resulting in a gain
of
756 points to the recent high at 1422. A 61.8% retracement of that
rally would put the index at 955, a loss of about 33% from the recent
high. That is the current risk implied from this study. That loss will
drop the hypothetical investor's retirement account from $91,500 to
about $61,500.
Risk: 33% downside from the recent market high = hypothetical retirement investor’s portfolio will drop from $91,500 to $61,500
Secular Bear Market Composite Comparison
Finally, let's look at a third way of measuring current implied risk by revisiting the comparison between the current secular bear market and the Secular Bear Market Composite. Recall that we combined the price data of the Dow Jones Industrial Average during the previous two secular bear markets, 1929-49 and 1966-82, to construct this Composite. And as we have said often, although the construction of the composite was intended to illustrate the general pattern of a secular bear market, it has been remarkable how closely the current market has tracked the composite since we first introduced it.
Naturally, the further we move away from the beginning (2000) of the current secular bear, the more likely the market is to diverge from the composite, at least in the short-term. Last month, we measured precisely the variation between the current secular bear market and the Composite over the course of the last twelve years. As it turned out, the current market recently registered a positive deviation of 25% above the level of the Secular Bear Composite, a margin it has reached only two other times since 2000.
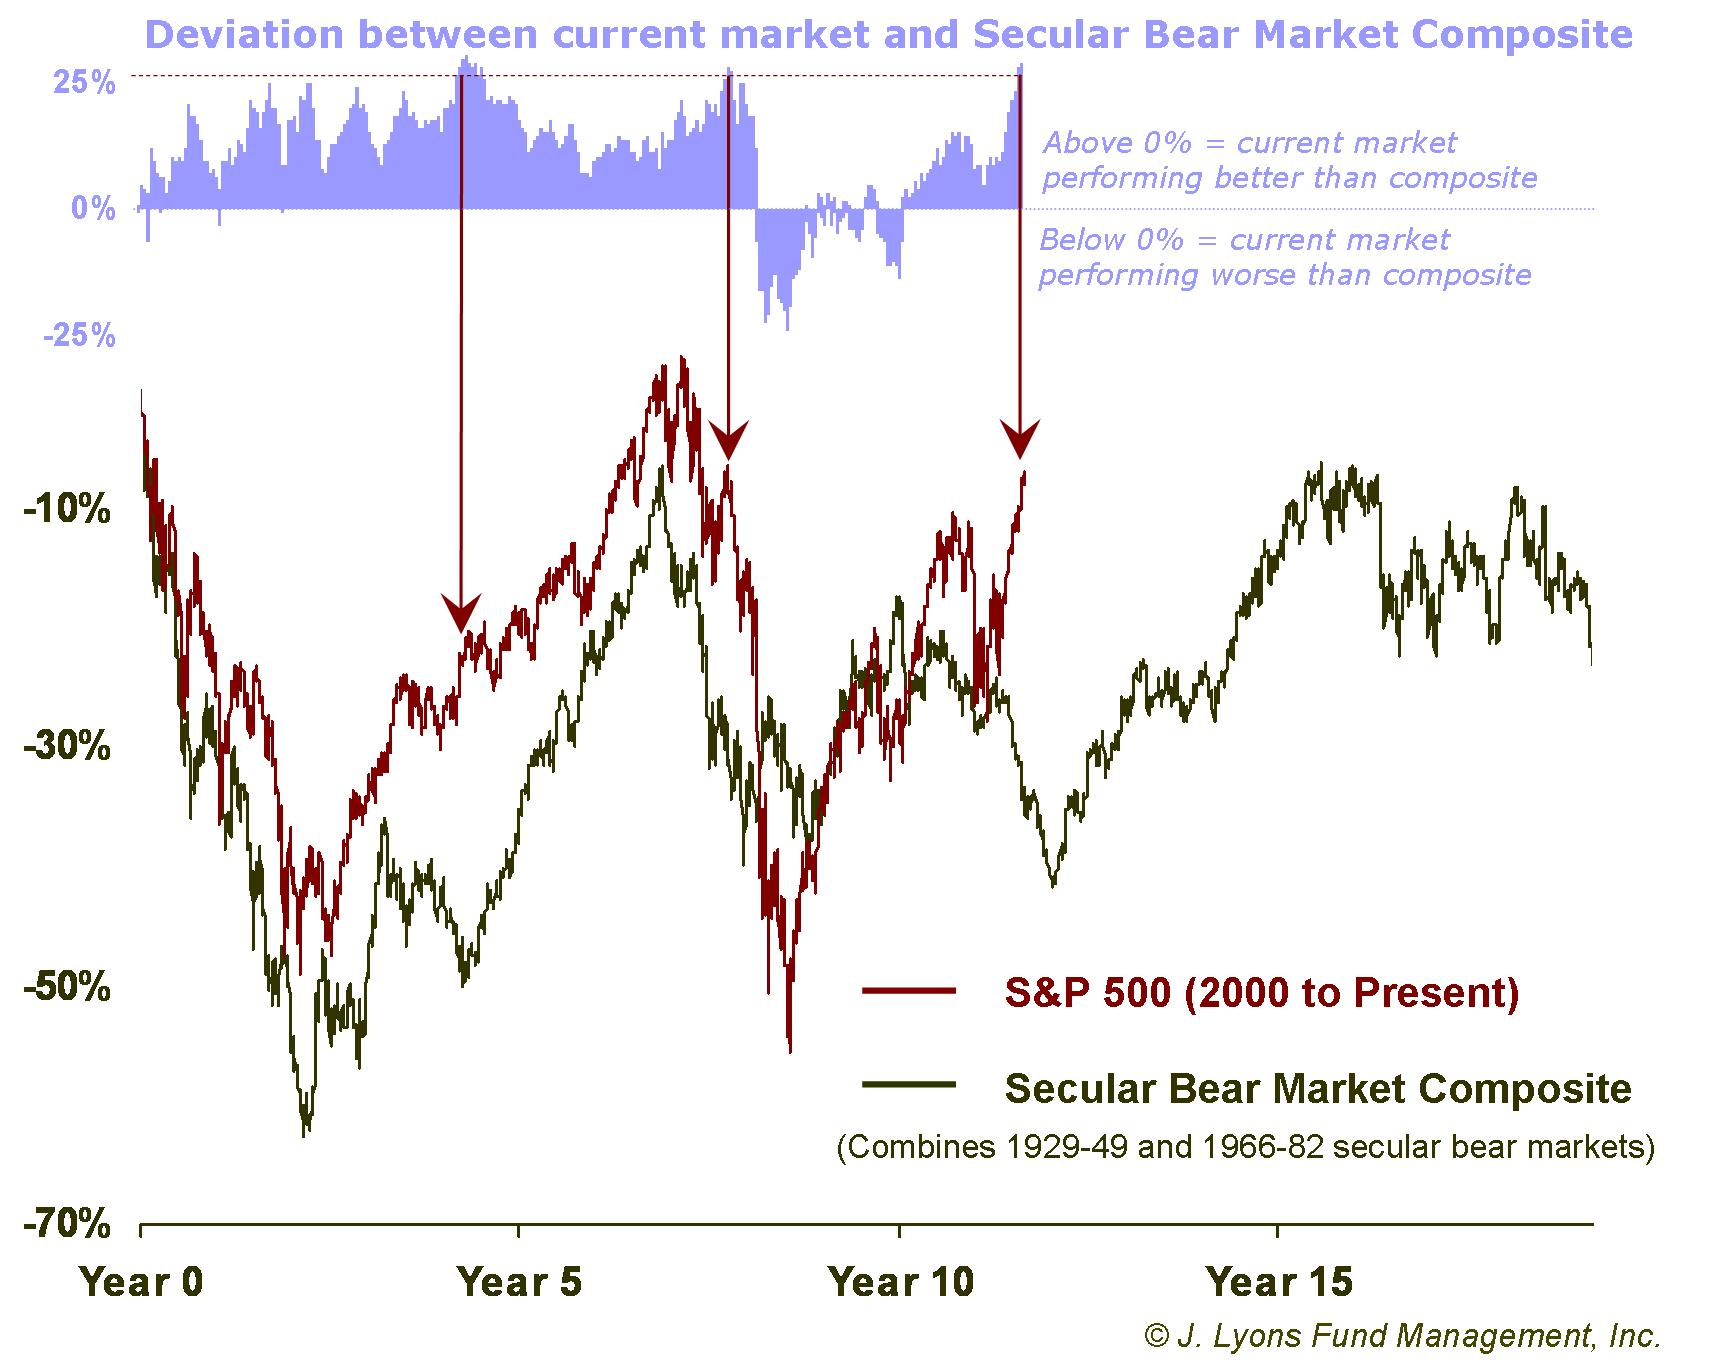
As we mentioned last month, the present secular bear market has
deviated more than 25% above the Secular
Bear Composite just two other times. The last occurrence was in May of
2008 and preceded a 50% drop in the S&P 500 over the subsequent
10
months into the March 2009 low. The risk now is that the market will
again correct to bring it back in line with the Composite.
Naturally, that would imply a 25% correction considering that is the amount of the divergence. However, the risk may be even greater than that. As can be seen on the chart, the Composite is currently in a downtrend. Therefore, the divergence is actually 25% and growing. Barring an immediate 25% crash, the current market needs to steadily decline just to maintain that gap between it and the Composite. In order to close the gap, the market will need to drop more than 25%.
How much more? The Composite is on track to bottom out at around the -42% level. Should the current market also trough at that level, it would reflect a drop of 37% from the recent high. That is the risk implied by this study. A 37% loss would drop the hypothetical investor's $91,500 retirement account to about $57,600.
Risk: 37% downside from the recent market high = hypothetical retirement investor’s portfolio will drop from $91,500 to $57,600
Conclusion
You are likely familiar with the quote, often attributed to Albert Einstein, that "the definition of insanity is doing the same thing over and over again but expecting different results." The characterization as insane may be a bit harsh in many circumstances, however. Often times, it is likely derived more from a force of conformity than a mental disorder that compels people to continue on a path even when it is not working. This is especially true when the object of conformity is almost unanimously accepted and rarely challenged, at least publicly. It is even more likely the case when those "experts" most knowledgeable in the subject are the most vocal proponents of conformity.
This is our attempt at letting investors "off the hook" for adopting the conventional buy-and-hold investment approach that has decimated, or at least put on hold, retirement plans for the past dozen years. Individual investors back in 2000-2002 should not have been expected to be on guard for the onset of a secular bear market and the tumultuous effects that come with it, particularly when all one hears is the passive, buy-and-hold propaganda. And perhaps investors could even be excused for staying with the strategy through the 2007-2009 market beatdown, hoping that the 2002 decline had merely been a fluke.
However, the notion of absolving investors of any responsibility in protecting their assets is officially over.
The evidence is now clear: one devastating strike to one's portfolio may be a fluke; two strikes is a trend. Conventional investment advice did nothing to reduce investors' risk in 2002 or 2008. To remain loyal to such an approach simply because it is mainstream is indefensible. Even if the purveyors of conventional advice had investors' best interest in mind (hint: they don't), it is clear they cannot protect you from a third strike. You owe them nothing. Your only responsibility is to the safeguarding of your retirement assets and investments.
We have laid out the case for an impending third strike in this secular bear market. There are those of us who stand ready to help. However, it is solely up to you to effect a change in your investment strategy so that you are protected this time. If the third strike unfolds as we fear and your retirement assets once again get reduced to about half of what they were twelve years ago, you will have no one to blame but yourself this time.
Dana Lyons
Vice President
The
commentary
included in this newsletter is provided for informational purposes
only. It does not constitute a recommendation to invest in any
specific investment product or service. Proper due diligence should be
performed before
investing in any investment vehicle. There is a risk of loss involved
in
all investments.